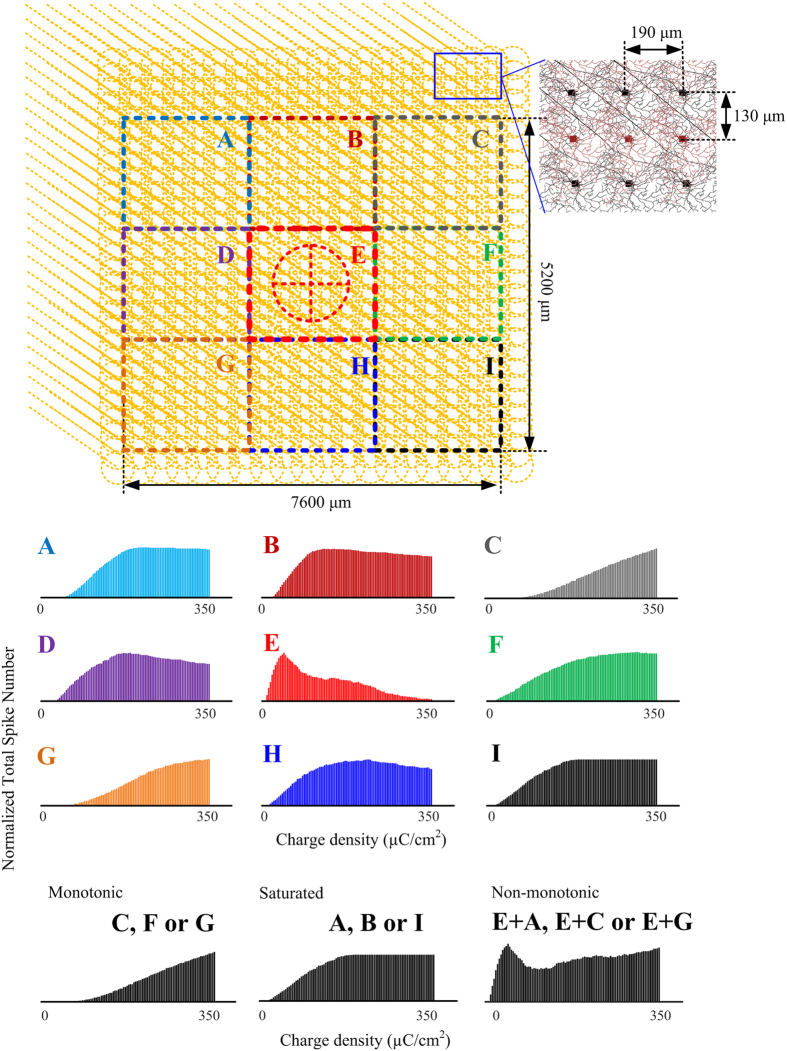
Figure 6. Upper panel: Population-based RGC model.
Nine functional regions (A–I) were classified around the stimulation electrode (red circle). Each region includes 13 × 13 cells. In total 39 × 39 cells were simulated. RGCs were uniformly distributed on a rectangular grid with 190 μm lateral and 130 μm longitudinal distances between neighbouring cells. Lower panel: Stimulus-response relationship reproduced by population-based RGC model. Total spike number of nine RGC populations was obtained in each functional region shown in the upper panel. All stimulation conditions were identical to those conducted in vivo. The charge density ranged from 0 to 350 μC/cm2. Three classified response patterns (monotonic, saturated and non-monotonic) were able to be reproduced by particular RGC populations or their combination, as indicated in the lower panel.

