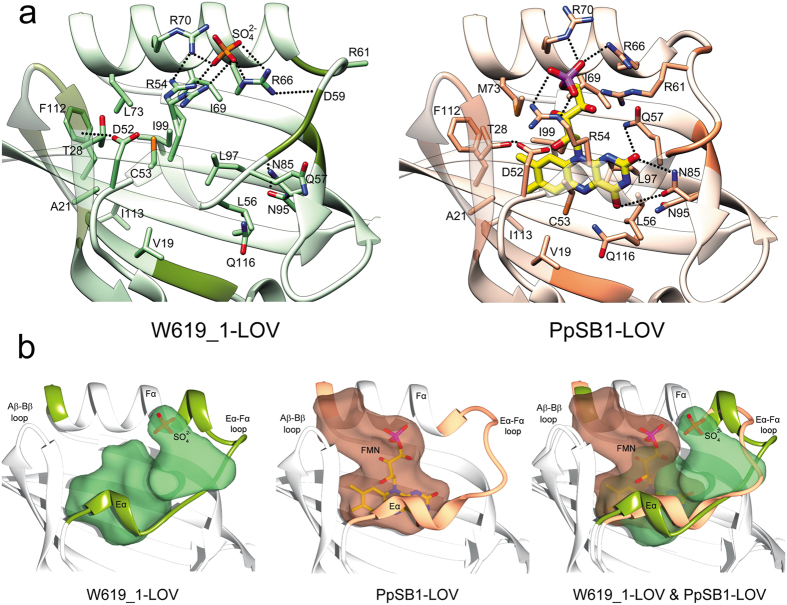
Figure 2. Comparison of the chromophore binding pocket of W619_1-LOV and PpSB1-LOV.
(a) Ribbon representations of W619_1-LOV (left panel, transparent green) and PpSB1-LOV (right panel, transparent salmon). The FMN-interacting protein residues lining the chromophore pocket within 4 Å cut-off distance are shown as stick models and >4 Å cut-off distance are shown as dark colored ribbon segments in PpSB1-LOV and for comparison, in the apo-state of W619_1-LOV. The sulfate ion in W619_1-LOV is shown as a stick model colored by element - oxygen, red; sulfate, orange. FMN bound to PpSB1-LOV is shown as stick model colored by element as in Fig. 1d. (b) Solvent accessible cavities created with 1.4 Å probe radius represented as transparent surface in W619_1-LOV (left panel, green) and PpSB1-LOV (middle panel, salmon). Sulfate ion and FMN molecule were not included for cavities calculations but are shown to indicate their positions in the respective structures. Superposition of W619_1-LOV and PpSB1-LOV (right panel) showing alignment of the two cavities, which differ in the two structures: extending towards the Aβ-Bβ loop and C-terminal end of the Fα helix in PpSB1-LOV, and towards the Eα-Fα loop and the N-terminus of the Fα helix in W619_1-LOV.

