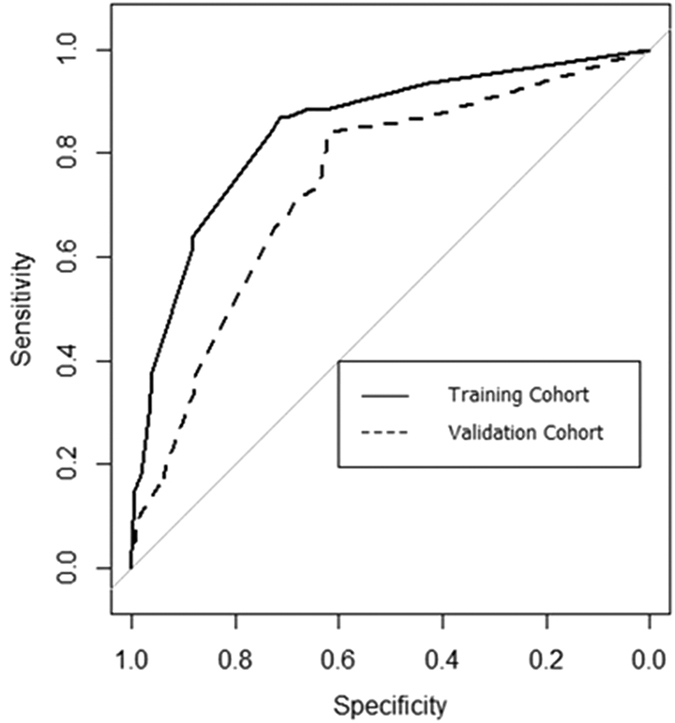
Figure 2. Discrimination and validation of nomogram.

The area under the curve of the nomogram was 0.847 in the training cohort (linear line), and 0.740 in the validation cohort (dotted line).

The area under the curve of the nomogram was 0.847 in the training cohort (linear line), and 0.740 in the validation cohort (dotted line).