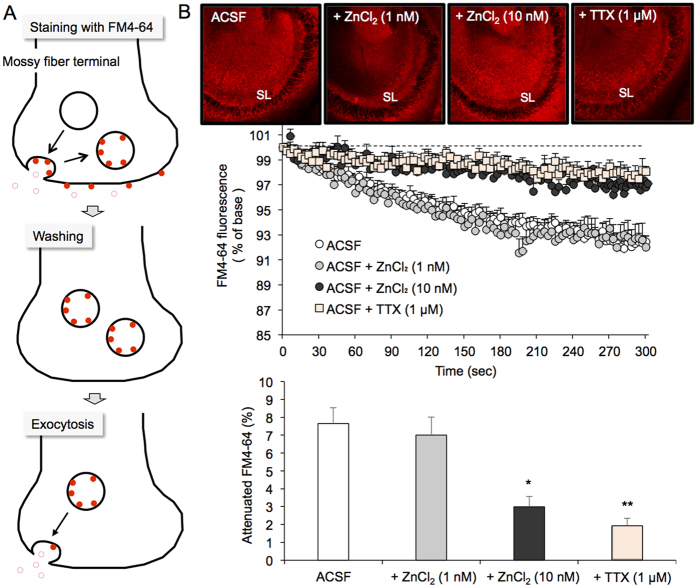
Figure 1. Suppression of spontaneous mossy fiber exocytosis of young rats in the presence of 10 nM ZnCl2.
(A) Schematic illustration of mossy fiber exocytosis assessed by attenuation of FM4-64 fluorescence. (B) FM4-64 fluorescence images in the CA3 after loading FM4-64 into slices bathed in ACSF, ACSF containing 1 nM Zn2+, and ACSF containing 10 nM Zn2+, and FM4-64 fluorescence image in the CA3 after loading of FM4-64 into slices bathed in ACSF and transferring the slices to ACSF containing 1 μM TTX (time 0 sec) (upper). Each point and line (mean ± SEM) represents the changes in FM4-64 fluorescence in the stratum lucidum (SL) of brain slices bathed in ACSF (n = 17), 1 nM ZnCl2 (n = 5), 10 nM ZnCl2 (n = 8) and 1 μM TTX (n = 6) after loading FM4-64 (time 0), which is expressed as 100%. (n = 6) (middle). Each bar and line (the mean ± SEM) represents the rate of the decreased FM4-64 fluorescence at time 300 sec (lower). *p < 0.05; **p < 0.01, vs. ACSF (Tukey’s test).

