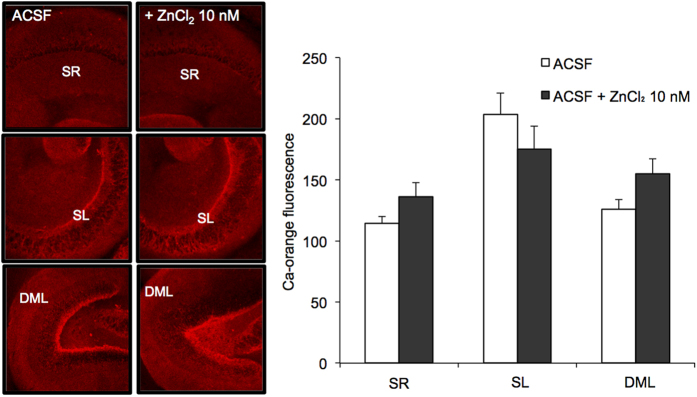
Figure 3. Intracellular Ca2+ imaging in the hippocampus of young rats with calcium orange AM.
Intracellular calcium orange fluorescence was imaged to estimate the basal levels of cytosolic Ca2+ in the hippocampus of brain slices bathed in ACSF (n = 7) and 10 nM ZnCl2 in ACSF (n = 7). SR, stratum radiatum; SL, stratum lucidum; DML. dentate molecular layer (left). Each bar and line (the mean ± SEM) represents fluorescent intensity in the SR, SL, and DML.

