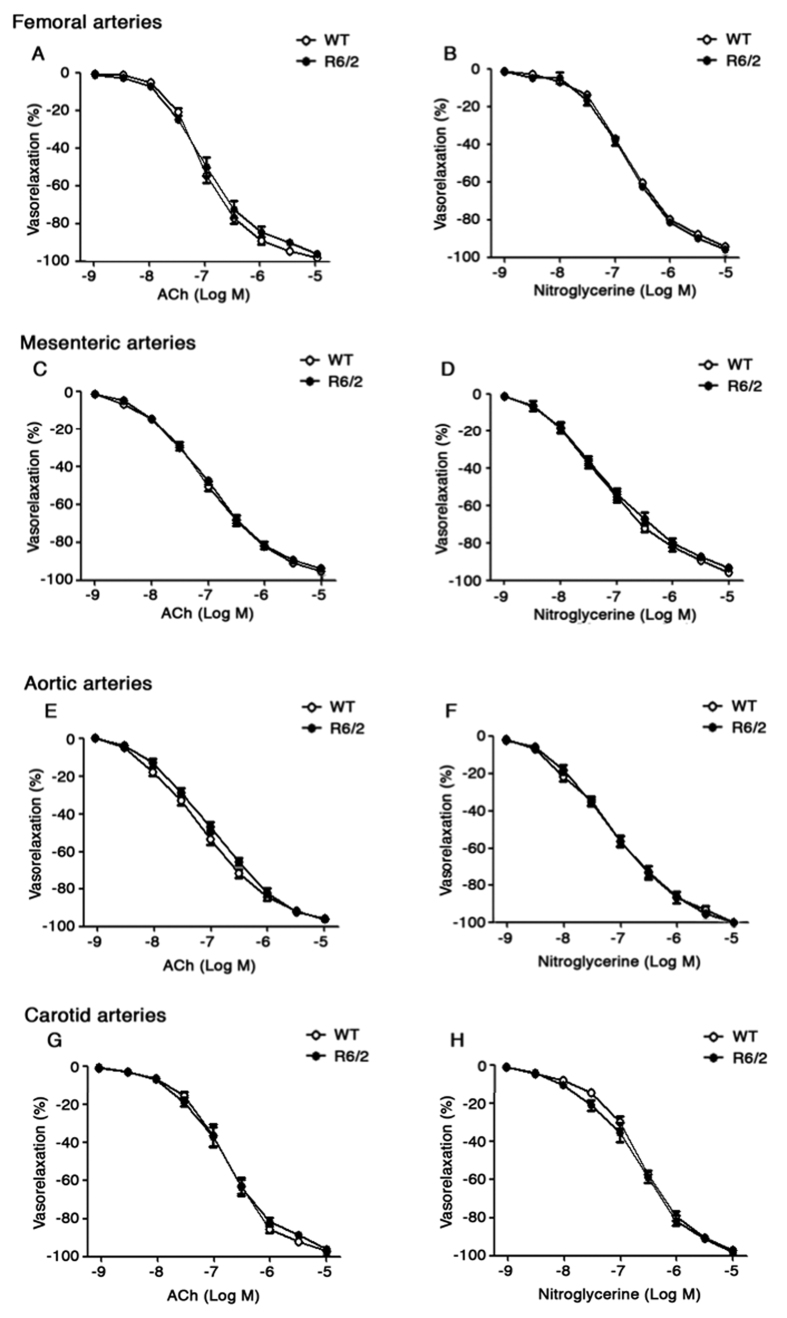
Figure 3. Analysis of vasorelaxation in HD mice.
Dose–response curves of phenylephrine-pre-contracted femoral (A,B), mesenteric (C,D), aortic (E,F) and carotid (G,H) arteries in response to acetylcholine (ACh) and nitroglycerine in symptomatic R6/2 mice and age-matched WT littermates. Data are expressed as mean per ± S.E.M. of 9 mice for each group. Two-way ANOVA with Bonferroni post-test.

