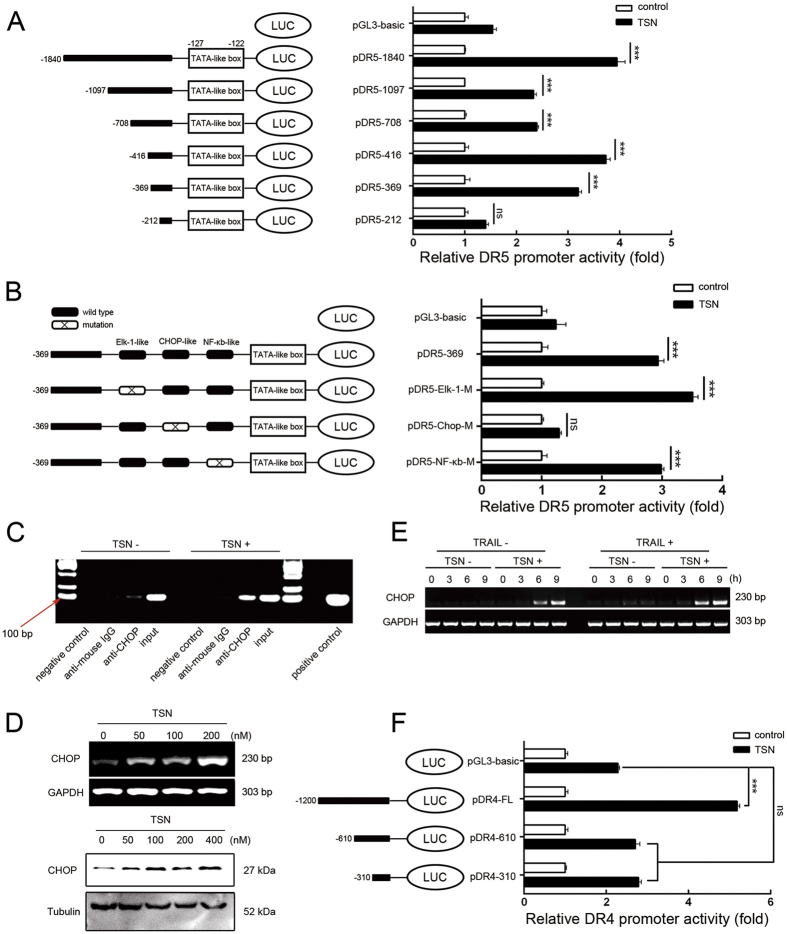
Figure 3. TSN upregulates the expression of death receptors at transcriptional levels.
(A) Construction of DR5 promoter reporter plasmid and its deletion mutants (left panel). A549 cells were transiently transfected with 0.8 μg indicated constructs and 0.2 μg pRL-TK for 24 h, and then treated with or without 200 nM TSN for another 24 h (right panel). The luciferase activity of untreated samples was arbitrarily set at 1.0 in each group. Data represent the mean ± SEM from three independent experiments. ***P < 0.001, as compared with control in each group. (B) Construction of DR5 promoter variants with point mutation in indicated sites (Left panel). A549 cells were transiently transfected with 0.8 μg indicated constructs and 0.2 μg pRL-TK for 24 h, and then treated with or without 200 nM TSN for another 24 h (right panel). The luciferase activity of untreated samples was arbitrarily set at 1.0 in each group. Data represent the mean ± SEM from three independent experiments. ***P < 0.001, as compared with control in each group. (C) A549 cells were challenged with 200 nM TSN for 6 h, binding of CHOP with DR5 promoter was assessed in a ChIP assay following the protocols described in materials and methods. IgG was used as a non-specific control. Each experiment was performed at least in triplicate. (D) A549 cells were treated with the indicated concentrations of TSN. After treatment, RT-PCR and western blot analyses were performed to evaluate the expression levels of CHOP. GAPDH and tubulin were used as loading controls; each experiment was performed at least in triplicate. (E) A549 cells were incubated with 200 nM TSN or 100 ng/ml TRAIL or both for indicated time. The mRNA expression level of CHOP was measured by RT-PCR analysis. GAPDH and tubulin were used as loading controls; each experiment was performed at least in triplicate. (F) Construction of DR4 promoter reporter plasmid and its deletion mutants (left panel). Drug treatment was similar as that in (A). Data represent the mean ± SEM from three independent experiments. ***P < 0.001, as compared with control in each group.

