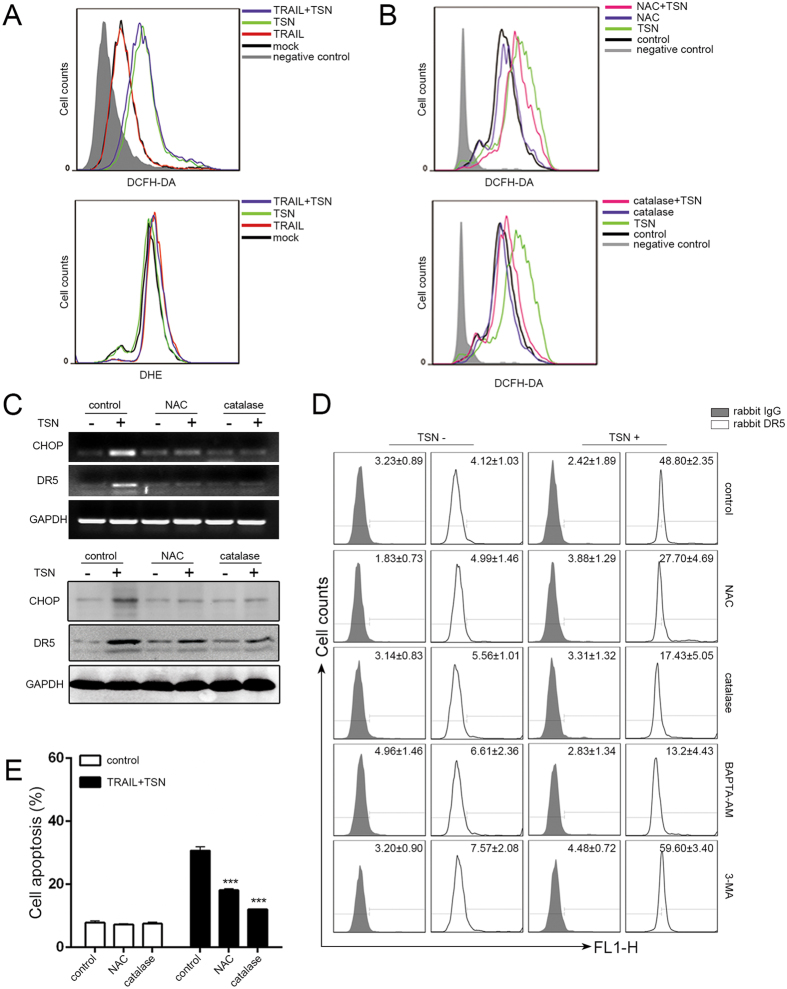
Figure 5. ROS generation is required for TSN-induced CHOP and DR5 upregulation.
(A) A549 cells were exposed to TSN, TRAIL, or TRAIL + TSN for 12 h, and then cells were collected and stained with DCFH-DA or DHE for measurement of H2O2, O2−.,respectively by flow cytometry. Each experiment was performed at least in triplicate. (B) Cells were pre-treated with ROS inhibitors (5 mM NAC or 100 U/ml catalase) for 30 min, and then treated with the indicated drugs. After treatment, cells were stained with DCFH-DA for the measurement of H2O2. Each experiment was performed at least in triplicate. (C) Cells were pre-treated with ROS inhibitors (5 mM NAC or 100 U/ml catalase) for 30 min, and then treated with the indicated treatment. RT-PCR and western blot analysi were employed to evaluate the expression levels of CHOP and DR5. GAPDH was included as loading controls; each experiment was performed at least in triplicate. (D) Cells were pre-treated with control/NAC (5 mM)/catalase (100 U/ml)/BAPTA-AM (5 μM)/3-MA (10 mM) before TSN treatment. At 12 h after TSN treatment, cells were harvested and the DR5 surface expression was measured by flow cytometry. Each experiment was performed at least in triplicate. (E) A549 cells were pre-incubated with 5 mM NAC or 100 U/ml catalase for 30 min, further treated with TRAIL (100 ng/ml) and TSN (200 nM) for 24 h, the occurrence of apoptotic cells was examined by flow cytometry. Data represent the mean ± SEM from three independent experiments, ***P < 0.001, as compared with control.

