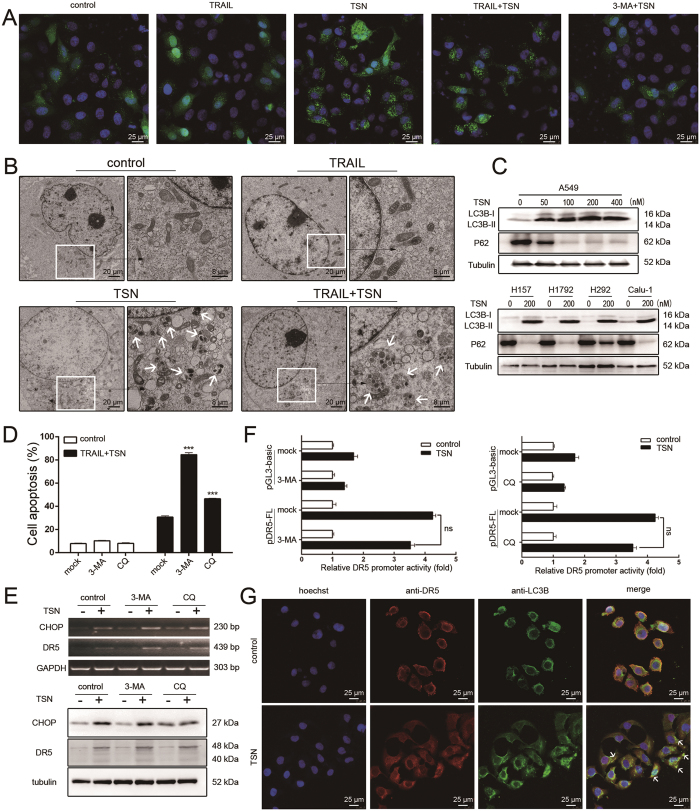
Figure 7. Autophagy alleviates the apoptosis-sensitizing effect of TSN.
(A) A549 cells were treated with indicated treatment for 8 h, after fixation, cell samples were examined under confocal microscopy. Each experiment was performed at least in triplicate. (B) A549 cells were treated with the indicated treatment for 8 h, and then were examined under transmission electron microscopy. (C) A549 cells and other NSCLC cells were treated for 12 h with different concentrations of TSN; the total protein was exacted and subjected to western blot analysis to evaluate the level of the indicated proteins. Tubulin was included as loading controls; each experiment was performed at least in triplicate. (D) A549 cells were pre-treated with 3-MA or CQ for 30 min, and then treated with 100 ng/ml TRAIL and 200 nM TSN for 24 h. Cell apoptosis was measured by flow cytometry. Data represent the mean ± SEM from three independent experiments, ***P < 0.001, as compared with control. (E) A549 cells were pre-treated with 3-MA or CQ for 30 min for 30 min, and further incubated with TRAIL and TSN. RT-PCR and western blot analysis were performed. (F) A549 cells were transiently transfected with 0.8 μg DR5 promoter plasmid and 0.2 μg pRL-TK for 24 h, and then incubated with 3-MA or CQ for 30 min before TSN treatment. Promoter activities were measured as previously described. The luciferase activity of untreated samples was arbitrarily set at 1.0 in each group. Data represent the mean ± SEM from three independent experiments. (G) A549 cells were treated with 200 nM TSN for 12 h. The autophagosome was visualized by immunostaining of LC3B (green). Hoechst was used to stain nuclei. DR5 was stained with anti-DR5 antibody. The merged pictures are shown in the right panels. White arrows were used to indicate the co-localization of DR5 and LC3B.

