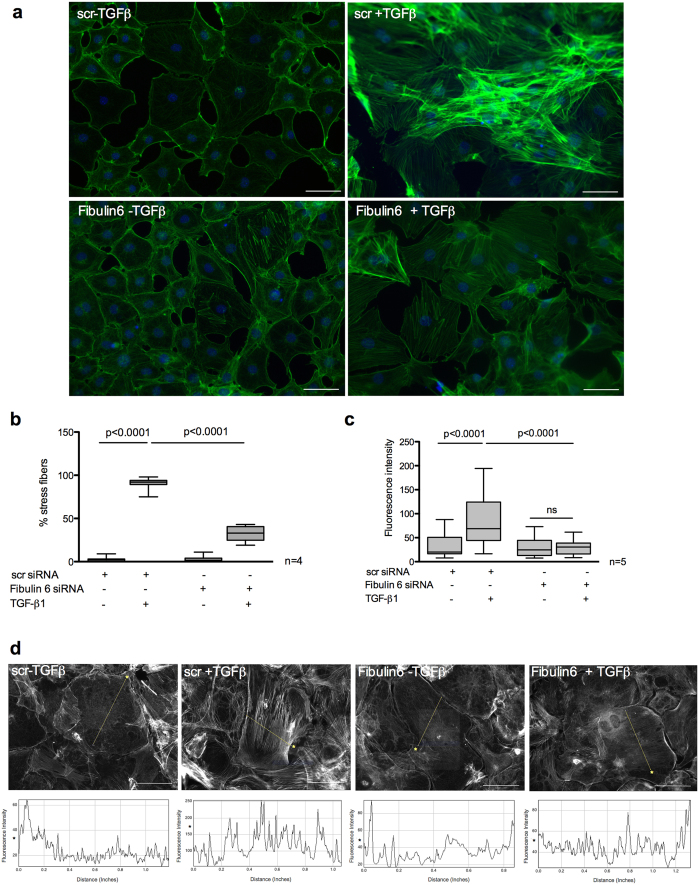
Figure 1. Attenuated stress fiber formation in fibulin-6 KD cells after TGF-β stimulation.
Fibroblasts isolated from neonatal mouse hearts and stimulated with TGF-β were stained with fluorescently labelled phalloidin for stress fibers. (a) scr-siRNA transfected nCF display increased stress fiber formation after TGF-β stimulation compared to non stimulated cells. In fibulin-6 KD cells stress fiber formation after TGF-β stimulation is almost absent (scale bar = 100 μm). (b) Total % of cells expressing stress fibers normalized to total number of cells. (n = 4, p < 0.0001) (c) Quantitative analysis of fluorescence intensity displayed by the stress fibers in the representative cells shown in panel (d) where each peak value correspond to 3 regions of the same cell with 6 cells analyzed per picture (n = 5, p < 0.0001). Differences in the mean value between groups are determined by two tailed, non-parametric Mann-Whitney U test. (d) Fluorescence intensities of the line drawn across the cell shown in corresponding panels below were quantified using Image J software. Asterisks demarcate cells being quantified and their corresponding line graphs below.

