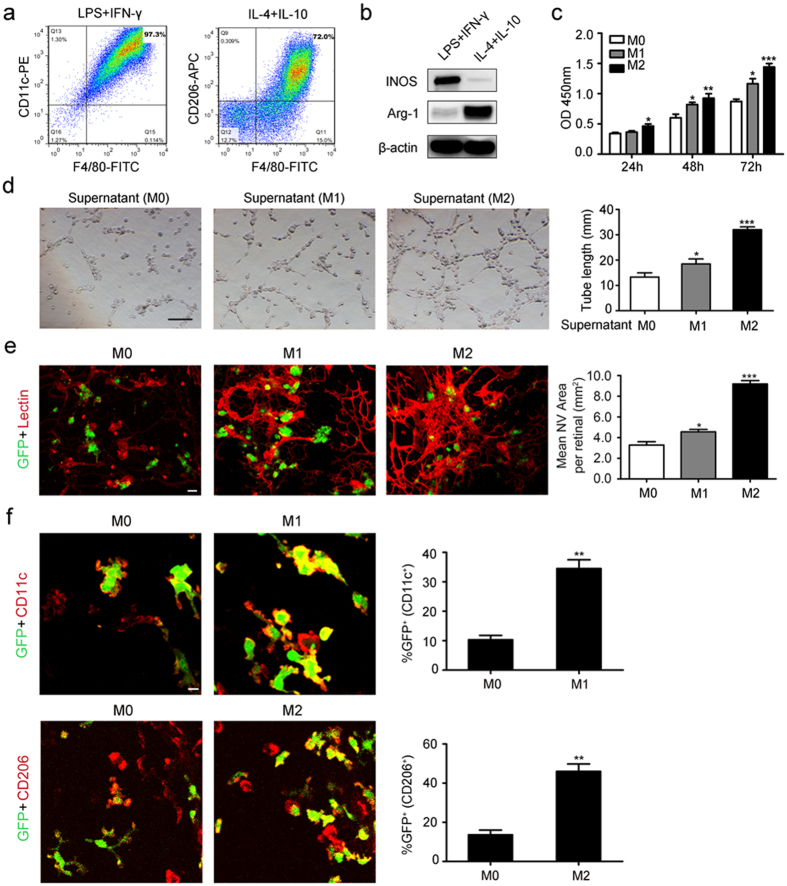
Figure 2. Both M1- and M2-like macrophages promoted pathologic neovascularization.
(a) Flow cytometry analysis of M1-like macrophages infiltration (F4/80+ and CD11C+) induced by LPS plus IFN-γ and M2-like macrophages infiltration (F4/80+ and CD206+) induced by IL-4 plus IL-10. (b) Western blot analysis of iNOS and Arg-1 post 24 hours of LPS plus IFN-γ or IL-4 plus IL-10 stimulation. (c) Time-curve of HUVECs proliferation induced by M0, M1 or M2 macrophages. (d) HUVECs tube formation post 24 hours of M0, M1 or M2 macrophages stimulation. Scale bar represents 100 μm. (e) Immunofluorescence analysis of lectin in the retinas of OIR mice after 5 days of EGFP-labeled M0, M1 or M2 macrophages intravitreal injection. Scale bars represent 10 μm. (f) Immunofluorescence analysis of CD11C+ and CD206+ macrophages in the retinas of OIR mice after 5 days of EGFP-labeled M0, M1 or M2 macrophages intravitreal injection. Scale bars represent 10 μm. *P < 0.05, **P < 0.01, ***P < 0.001. P values were analyzed by one-way ANOVA in (c–e) and t-test in (f). All data are representative of three independent experiments and are means ± SEM.

