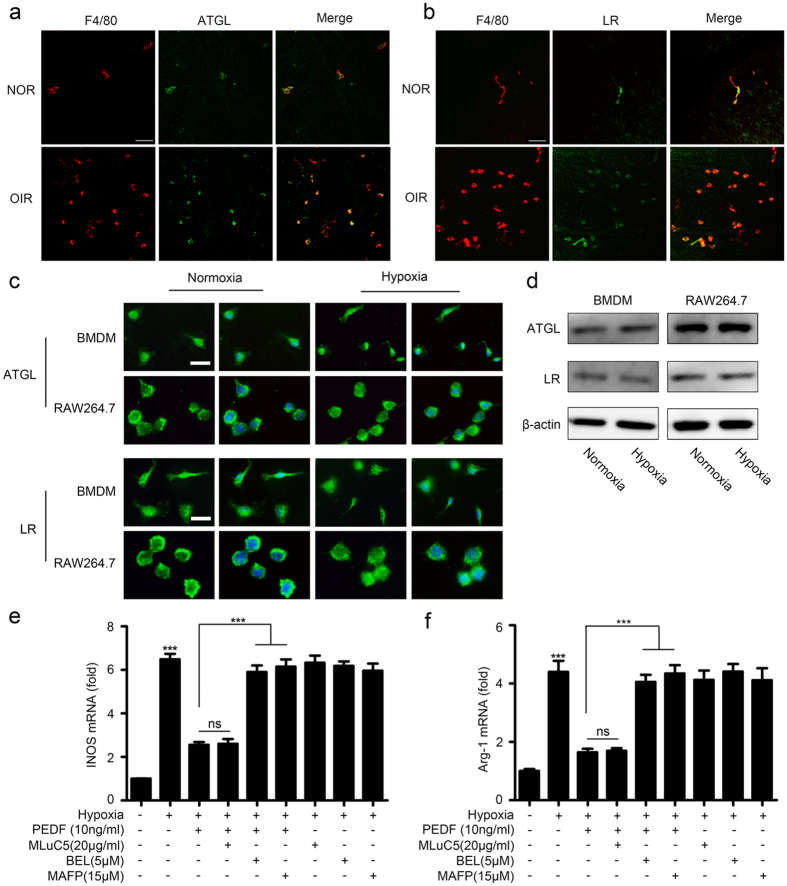
Figure 7. PEDF regulated hypoxia-induced macrophages polorization via ATGL.
(a,b) Immunofluorescence analysis of ATGL and LR expression on macrophages of retinas in the OIR model by ATGL plus F4/80 (a) or LR plus F4/80 (b) staining. Scale bars represent 50 μm. (c) Immunofluorescence analysis of ATGL and LR expression in macrophage RAW264.7 and BMDMs with or without hypoxia treatment. Scale bars represent 10 μm. (d) Western blot analysis of ATGL and LR expression in macrophages RAW264.7 and BMDMs with or without hypoxia treatment. (e,f) Quantification of iNOS and Arg-1 expression in BMDMs induced by hypoxia prior to stimulation with PEDF and/or ATGL specific inhibitor BEL/ATGL selective inhibitor MAFP/LR antibody MluC5. ***P < 0.001, P values were analyzed by one-way ANOVA. All data are representative of three independent experiments and are means ± SEM.

