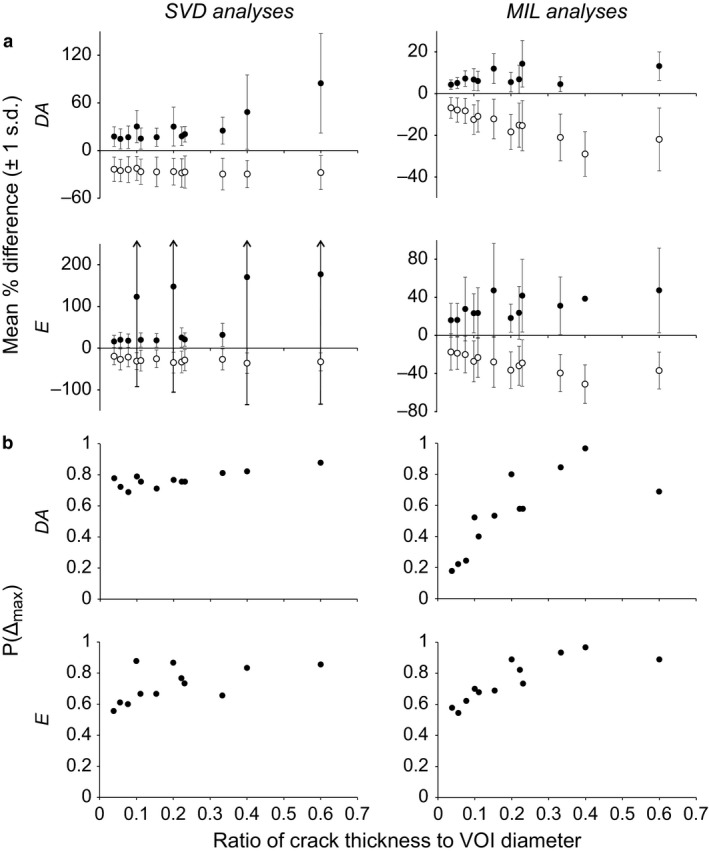
Figure 2.

The effect of cracks on scalar variables describing the cancellous bone fabric tensor. (a) In terms of the mean percentage difference from the pristine sample. (b) In terms of P(Δmax), the proportion of instances where the maximum acceptable difference was exceeded. For the mean difference plots, filled circles denote positive differences from the values for the pristine sample, and hollow circles denote negative differences from the values for the pristine sample.
