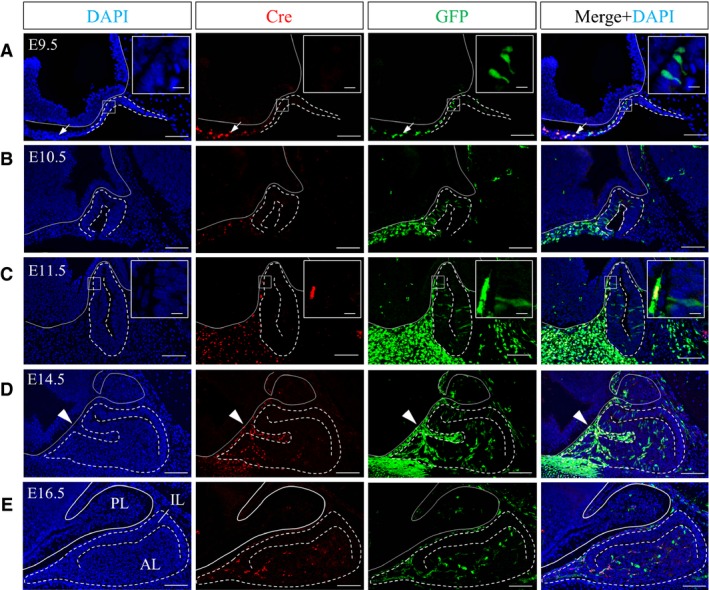
Figure 1.

Localization of GFP‐ and/or Cre‐positive cells during embryonic pituitary development. Sagittal sections on (A) E9.5, (B) E10.5, (C) E11.5, (D) E14.5 and (E) E16.5 were reacted with anti‐Cre antibody (visualized with Cy3, red) and anti‐GFP antibody (visualized with FITC, green). Images of individual staining with DAPI, Cre or GFP, and merged images (left to right panels, respectively) are shown. Boxed areas in (A) and (C) are enlarged in the upper right of each panel. Dotted lines show the outline of the pituitary gland. Solid lines show the outline of the neuroectoderm. Arrowheads indicate Atwell's recess. AL, anterior lobe; IL, intermediate lobe; PL, posterior lobe. Scale bars: 100 μm (enlarged area: 10 μm).
