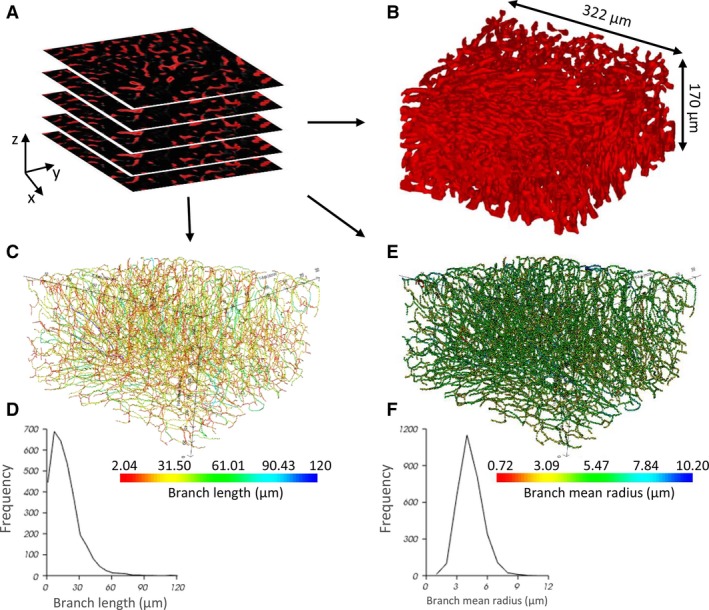
Figure 7.

The morphological graph analysis pipeline for microsamples obtained by immunohistochemistry (IHC) and vascular corrosion casting (VCC). (A) Segmented 2D image stack of a IHC cleared sample (B) 3D reconstruction of the segmented structures (dimensions 322 × 322 × 170 μm3). (C) Visualization of the network graph, where the edges are colored according to their branch length. (D) Histogram of the branch length. (E) Visualization of the network graph, where the nodes are colored according to their branch mean radius. (F) Histogram of the branch mean radius.
