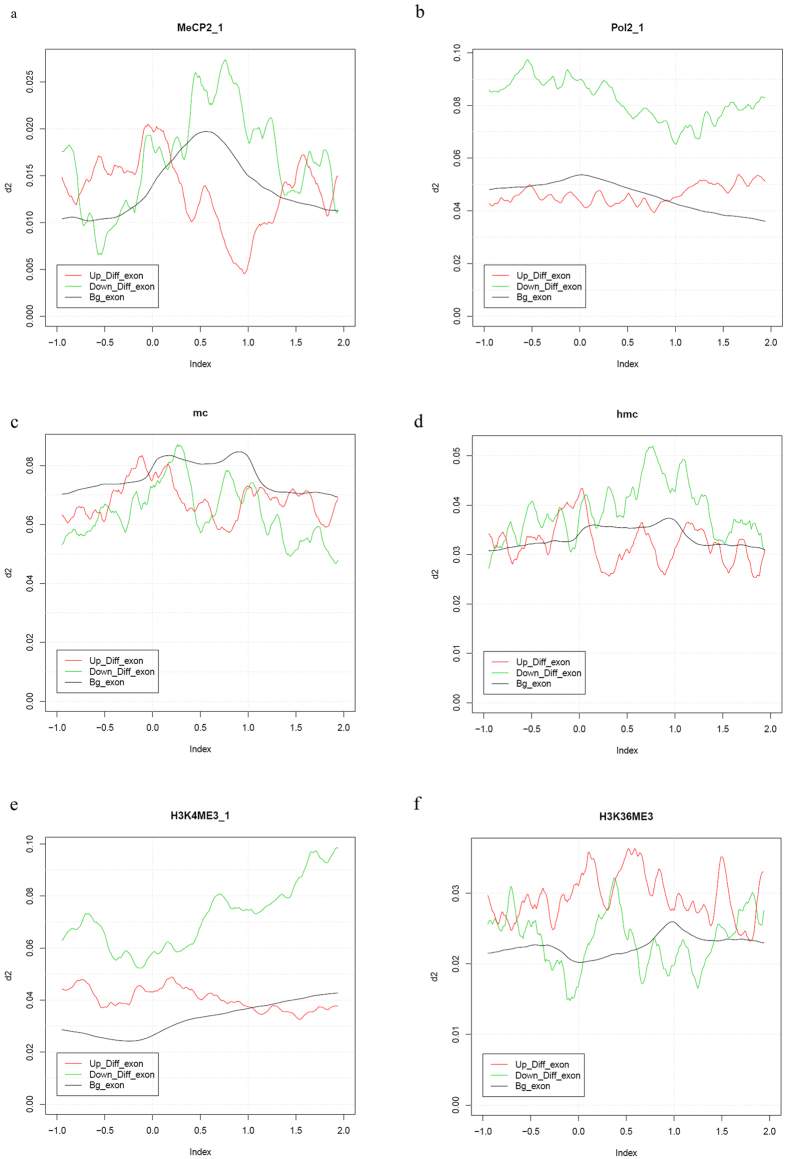
Figure 3. Protein distribution and epigenetic signatures in MeCP2-regulated exons.
(a) Average diagram of MeCP2 ChIP-Seq data in exons which were up-regulated, down-regulated or unchanged in MeCP2-knockdown neurons. The Y axis represents the degree of ChIP-Seq data relative to input, and the X axis indicates the relative distance of exons, in which each exon was equally divided into 100 parts, with 0.0 representing the start position of exon and 1.0 represents the end position of exon. (b) Average diagram of Pol II ChIP-Seq data in exons which were up-regulated, down-regulated or unchanged in MeCP2-knockdown neurons. (c) Average diagram of 5 mC status in exons which were up-regulated, down-regulated or unchanged in MeCP2-knockdown neurons. (d) Average diagram of 5 hmC status in exons which were up-regulated, down-regulated or unchanged in MeCP2-knockdown neurons. (e) Average diagram of H3K4me3 ChIP-Seq data in exons which were up-regulated, down-regulated or unchanged in MeCP2-knockdown neurons. (f) Average diagram of H3K36me3 ChIP-Seq data in exons which were up-regulated, down-regulated or unchanged in MeCP2-knockdown neurons.

