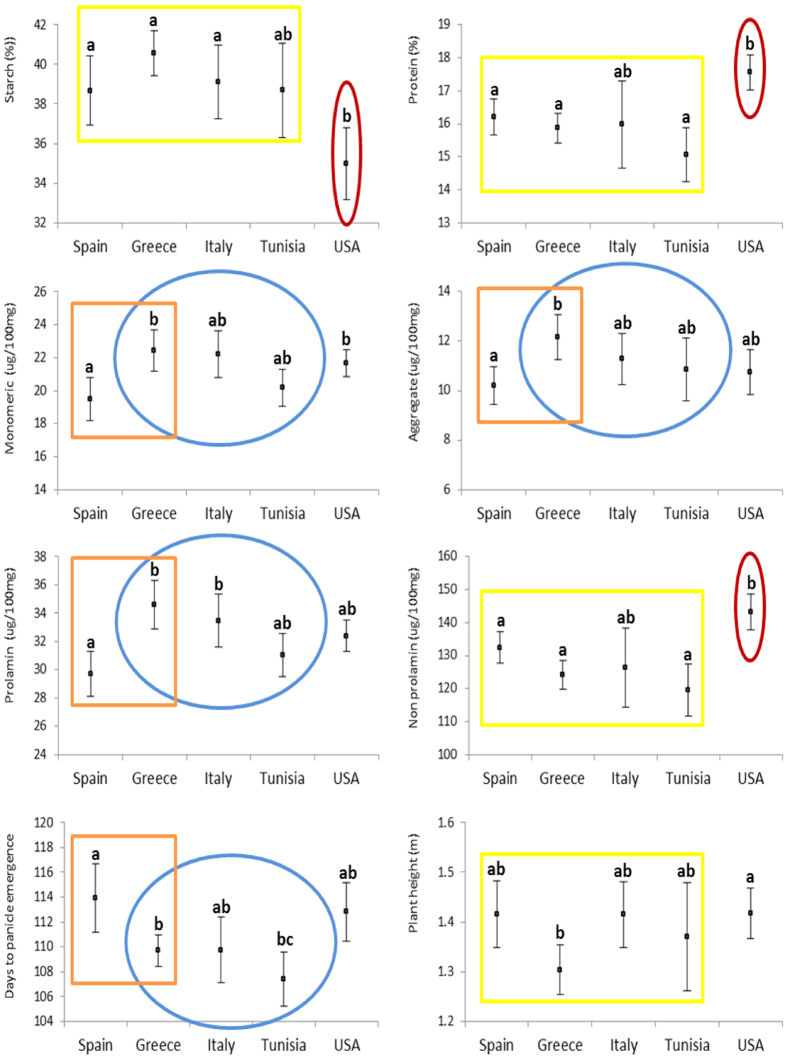
Figure 1. Means and 95% CIs for agronomic plant traits and flour quality composition of oat accessions grouped by their origin.
Different letters mean a significant difference (p < 0.05). Yellow rectangles indicate no significant differences among Mediterranean accessions; Blue ovals and orange squares highlight differences between Spanish and Greek accessions. Red ovals indicate that a mean is significantly different from at least other three group means.

