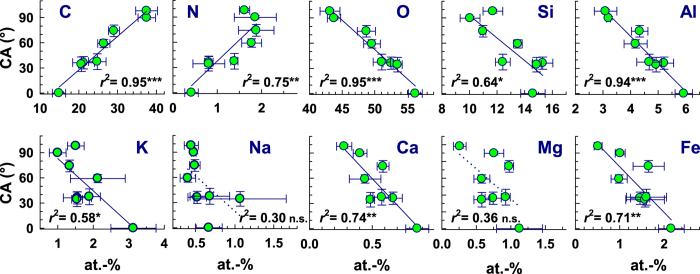
Figure 1. Surface wetting properties in terms of contact angle (CA) as function of XPS-detected element content.
The lines represent linear regression fits. Significance levels: *P < 0.05; **P < 0.01; ***P < 0.001. The dotted lines added to the plots with no significant correlation (Na, Mg) indicate the general trend.

