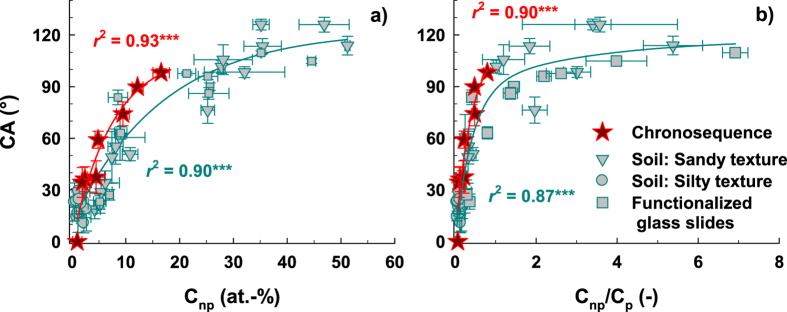
Figure 3. Contact angle (CA) as function of the amount of non-polar C species (Cnp) (a; n = 48) and as function of the ratio between non-polar and polar C species (Cnp/Cp) (b; n = 48) for the chronosequence samples (red stars) and further sample sets differentiated by texture and origin (grey symbols).
The lines represent exponential regression fits. The coefficients of determination and significance levels in red refer to the chronosequence samples and the coefficients of determination and significance levels in cyan refer to all sample sets including the chronosequence samples. Significance level: ***P < 0.001.

