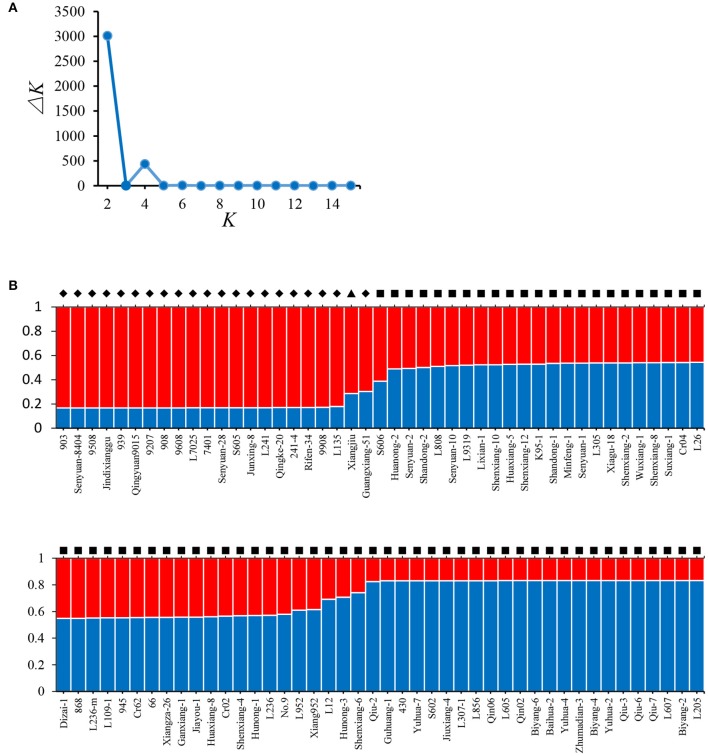
Figure 3.
Results of STRUCTURE analysis. (A) Estimation of the number of populations for K ranging from 2 to 15 by ΔK values; (B) Classification of 89 L. edodes cultivars into two genetic groups. The distribution of the strains assigned to different groups is indicated by the color code (Group A: red, Group B: blue). The y-axis quantifies the cluster membership, and the x-axis lists the different strains. Strains from the different groups defined in the NJ tree are marked in different symbols: ♦, Group A; ■, Group B; ▴, Xiangjiu, excluded from the two groups in the NJ tree.

