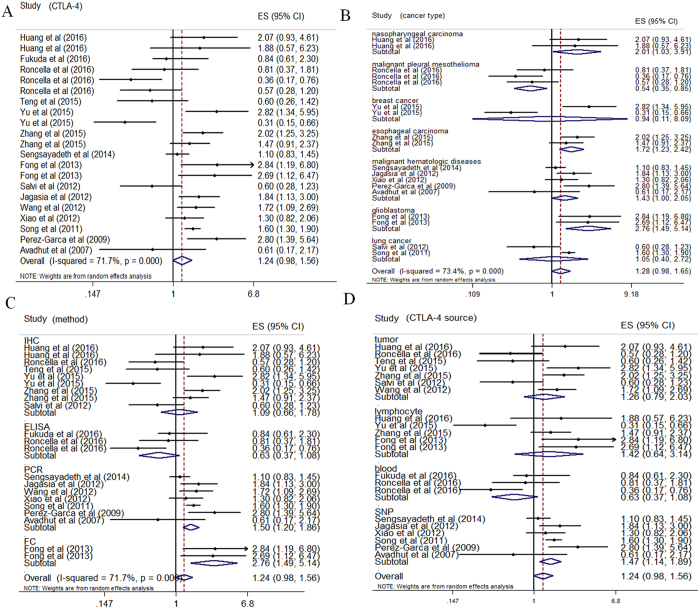
Figure 4. Forrest plots evaluating maximally adjusted association between CTLA-4 expression and OS.
(A) Forrest plot to assess the overall effect of CTLA-4 on OS in all cancer patients. (B) Forrest plot to assess the effect of CTLA-4 on OS in subgroups divided by cancer types. (C) Forrest plot to assess the effect of CTLA-4 on OS in subgroups divided by experimental methods. (D) Forrest plot to assess the effect of CTLA-4 on OS in subgroups divided by CTLA-4 sources.

