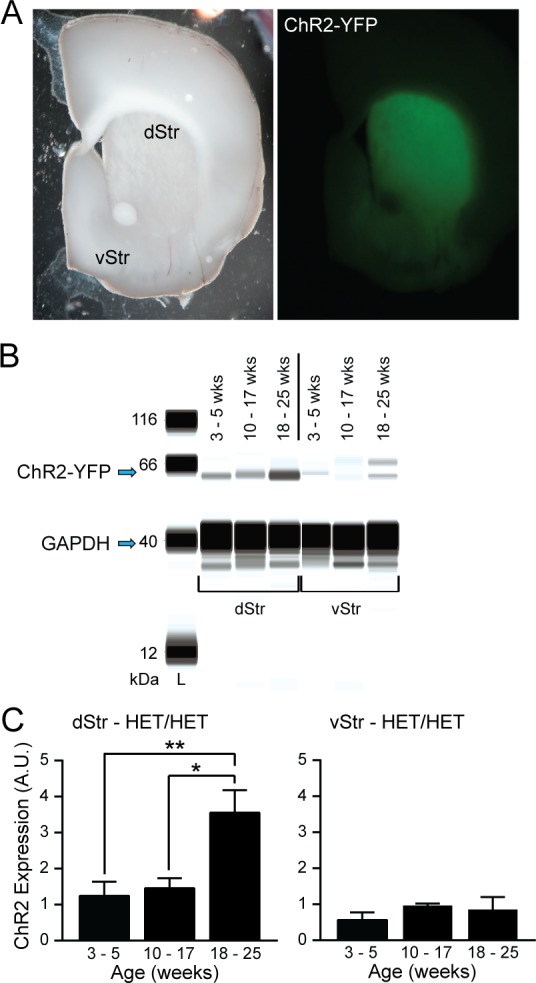
Figure 2.

ChR2–YFP expression with age in HET/HET dStr and vStr. (A) Coronal striatal slices viewed through a fluorescent stereomicroscope with either brightfield illumination (left) or a green filter cube to reveal YFP-fused ChR2 expression (right). (B) Example capillary electropherograms from immunoassays (SimpleWestern) for YFP and GAPDH (a loading control protein) for dStr and vStr from 3–5 week old, 10–17 week old, and 18–25 week old HET/HET mice. (C) Summary of YFP expression (as percent of GAPDH) in dStr (left, n = 5–6 samples from 3–4 mice per age group) and vStr (right, n = 3–4 samples from 3–4 mice per age group). Data are means ± SEM and comparisons were made using one-way ANOVA followed by Tukey’s post hoc tests (*p < 0.05, **p < 0.01).
