Figure 7.

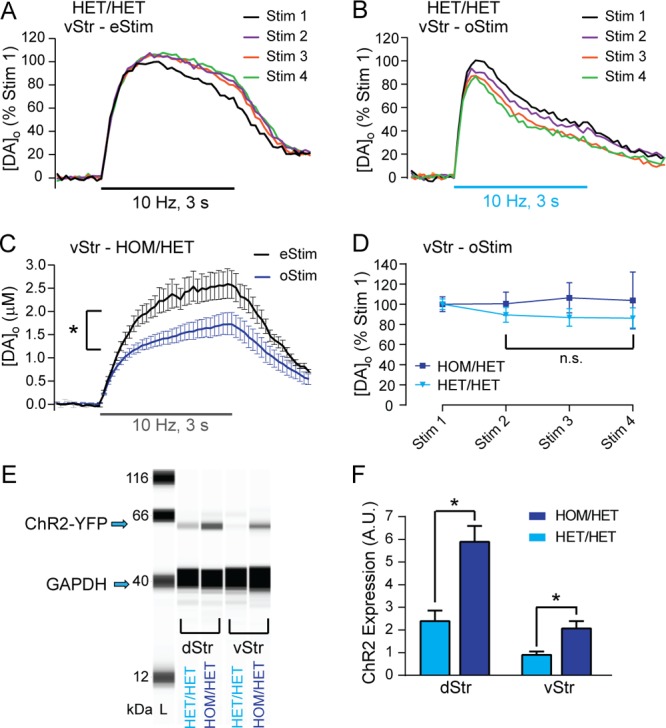
Pulse-train oStim-evoked increases in [DA]o are stable in the vStr of HOM/HET mice that express higher striatal ChR2 than seen in HET/HET mice. (A) Representative records from the first four consecutive pulse-train (30 pulses, 10 Hz) eStim-evoked increases in [DA]o in the vStr of a HET/HET mouse. (B) Same as in panel A, except that increases in [DA]o were evoked by same-site oStim. (C) Average pulse-train evoked responses in vStr of HOM/HET mice with repeated same-site eStim (black trace; n = 6 stimulations in slices from 2 mice) or oStim (dark blue trace; n = 15 stimulations in slices from 5 mice). (D) Summary of peak evoked oStim responses during four consecutive pulse-train stimulations in HET/HET mice (light blue triangles; from panel B) and HOM/HET mice (dark blue squares) normalized to Stim 1. (E) Example capillary electropherograms from immunoassays (SimpleWestern) for YFP and GAPDH (a loading control protein) for HET/HET and HOM/HET dStr (left) and vStr (right). The YFP antibody labeled a band at ∼60 kDa, which is the molecular weight (MW) of YFP plus ChR2 to which it is fused. (F) Summary of YFP expression (as percent of GAPDH) in dStr (left, n = 11 samples from 4 mice) and vStr (right, n = 7 samples from 4 mice) of HET/HET (light blue bars) and HOM/HET mice (dark blue bars; n = 7 samples from 4 mice for dStr, and n = 5 samples from 4 mice for vStr. Data are means ± SEM and comparisons were made using a two-way ANOVA followed by Holm–Sidak tests (*p < 0.05).
