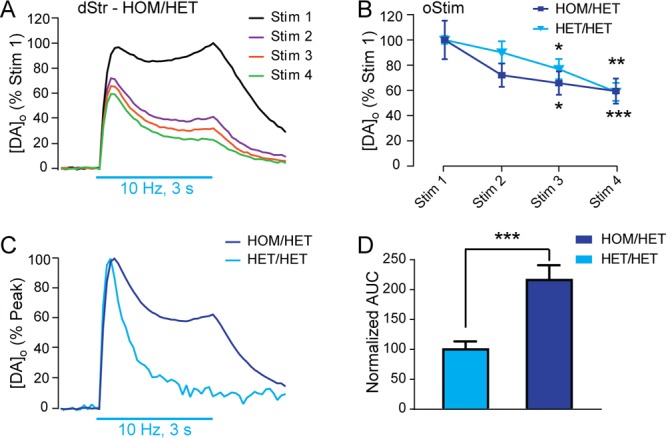
Figure 8.

Pulse-train oStim-evoked increases in [DA]o are broadened in HOM/HET dStr. (A) Average pulse-train oStim-evoked increases in [DA]o from four consecutive stimulations in dStr of HOM/HET mice (n = 4 sites in slices from 4 mice) demonstrates a broadened response, especially in Stim 1; error bars are omitted for clarity. (B) Summary of panel A showing the average peak evoked [DA]o during oStim pulse-trains in HOM/HET mice as well as in HET/HET mice; in both genotypes there was a significant difference between Stims 3 and 4 vs Stim 1 at the peak of the response (*p < 0.05, **p < 0.01, **p < 0.001; upper symbols pertain to comparisons within HET/HET data, lower symbols for HOM/HET data). (C) Average of Stims 1–4 in same-site experiments in HOM/HET (dark blue trace; n = 16 stimulations in slices from 4 mice) and HET/HET mice (light blue trace; n = 11 stimulations in slices from 4 mice), each normalized to their own peak. (D) Quantitation of the area under the curve (AUC) during the 3 s stimulus train for the records in panel C. The AUC was normalized to that in HET/HET mice to quantify the protracted increase in evoked [DA]o vs time in HOM/HET dStr compared to the response in HET/HET mice (***p < 0.001, unpaired t-test with Welch’s correction). All data are means ± SEM and comparisons for panel B were made using a two-way repeated-measures ANOVA with Dunnett’s tests within genotypes (oStim1 vs oStim2/3/4).
