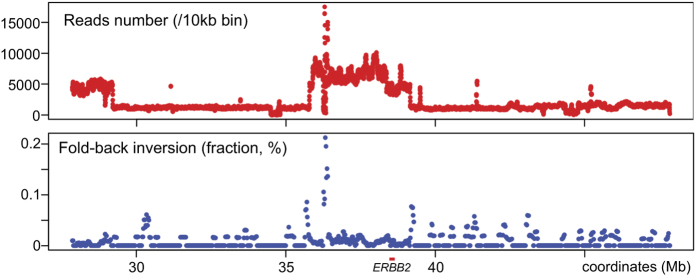
Figure 5. Copy numbers (top) and fold-back inversions (palindromic DNA) obtained from the whole genome sequencing data of BT5 tumor DNA.
Results for the 20 Mb region flanking ERBB2 is shown. Copy number alterations are shown by the read depth and fold-back inversions are shown as a fraction of total reads for each 10 kb bin.

