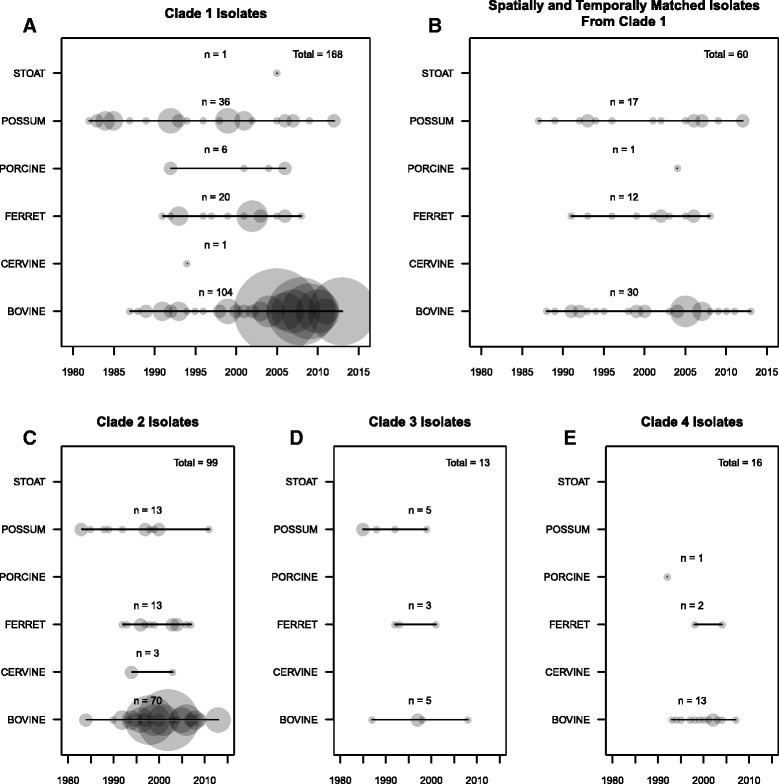
Fig. 2.

Five plots illustrating the temporal range associated with each sampled host species for all the isolates in the different clades (1 (a), 2(c), 3(d), and 4(e)), and the spatially and temporally associated isolates from clade 1 (b). The size of each point is scaled by the number of isolates that were taken from the given species in the given year
