Fig. 3.

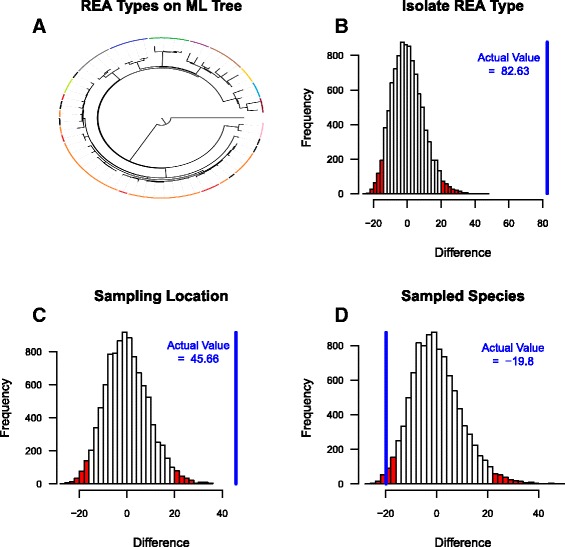
Clustering in the inter-isolate genetic distance distribution for the spatially and temporally matched isolates from clade 1. a A Maximum Likelihood phylogenetic tree generated using PHYLIP; coloured bars are used to highlight isolates that have the same REA type (note that REA types that are only represented by one isolate are colour in black). b, c, and d Three plots showing how the observed difference between the mean inter- and mean intra-group genetic distances, when isolate groups were defined by REA, Sampling Location, and Species (b, c, and d, respectively) compared to null distributions of differences calculated on shuffled sequences. The sampling location was defined as the region where sampling occurred. The difference was calculated for 10,000 independently shuffled sets. Only the spatially and temporally matched isolates from clade 1 were used in this clustering analysis. The blue line shows the observed difference between mean inter- and mean intra-group genetic distances. The area outside of the lower (2.5%) and upper (97.5%) bounds of the null distribution are coloured in red
