Fig. 5.

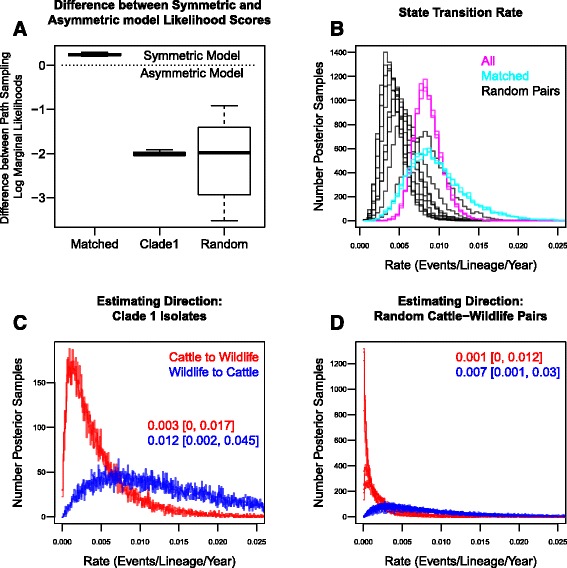
The state transition rates estimated by a discrete traits analysis in BEAST on isolates selected from clade 1. States were defined as either Cattle or Wildlife. BEAST analyses were completed using all the clade 1 isolates (3 replicates), only spatially and temporally matched isolates (3 replicates) and 30 randomly matched cattle and wildlife isolates (10 replicates). a A box plot of the difference between the likelihoods (estimated using path sampling) of the symmetric and asymmetric models for the different sampling sets. The symmetric model was favoured for the matched isolates and the asymmetric model for the analyses based on all the clade 1 isolates and randomly matched cattle and wildlife. b The sampled (n = 10,000) posterior distributions of the estimated overall transition rate between Cattle and Wildlife based on the three sampling sets. Plots (c and d) show the posterior distributions of the transition rates from Cattle to Wildlife (Red) and Wildlife to Cattle (Blue) resulting from BEAST analyses completed on the clade 1 isolates and the randomly matched isolates. The median and 95% Credible Intervals are stated for the distributions
