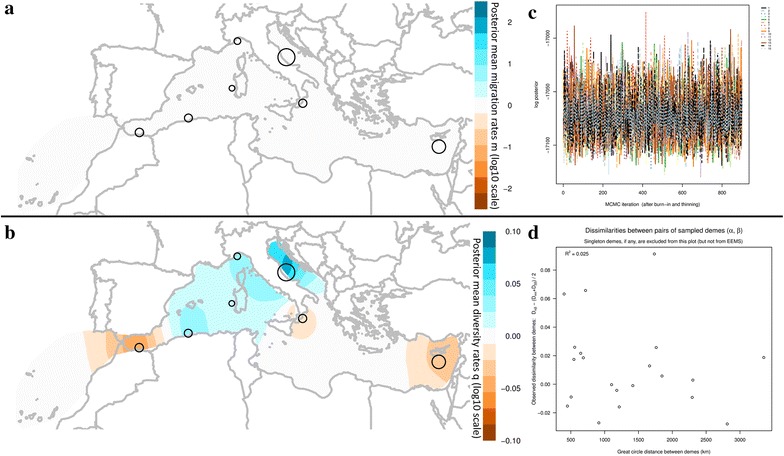
Fig. 4.

EEMS analysis of the microsatellite dataset of Riccioni et al. [22] with 316 samples of Bluefin tuna from the Mediterranean based on 7 microsatellite loci. Empty circles correspond to the studied geographic sites with their sizes being proportional to the number of samples analyzed in the study of Riccioni et al. [22]. a, b averaged, over different grids, effective migration rates (m), and diversity contour plots (q) respectively, c diagnostic plot of MCMC iterations vs log posterior of all runs (n = 15) where there is no indication of non-convergence, d scatterplot of the observed between demes pairwise genetic differences against the geographic distances of the demes (Great circle distances in Km). The coefficient of determination indicated at the top left of the scatterplot is equal to R2 = 0.025
