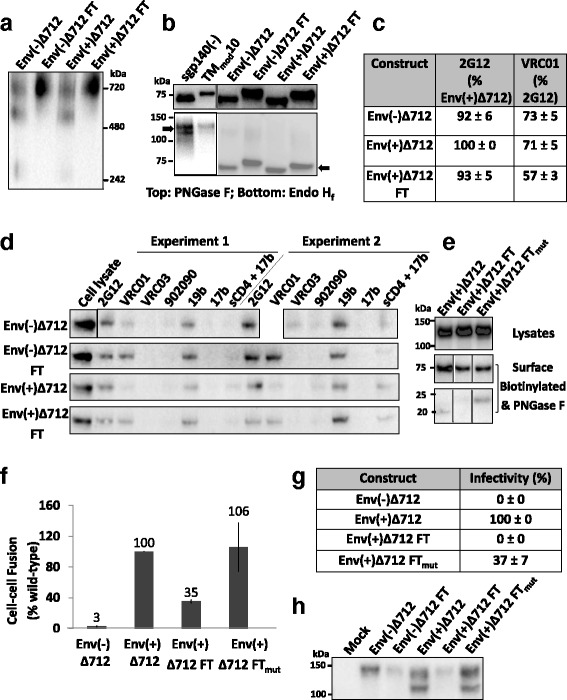
Fig. 5.

Effect of the C-terminal fibritin trimerization motif on membrane-anchored Envs. a Envs purified from transfected 293T cell membranes were analyzed by Blue Native PAGE. The Env(−)Δ712 FT and Env(+)Δ712 FT glycoproteins migrate at a size expected for trimers. b The purified soluble or membrane Envs were treated with PNGase F (top panel) or Endo Hf (bottom panel). The arrows indicate Envs after Endo Hf digestion. Compared to sgp140(−) and TMmod10 Envs, which are relatively resistant to Endo Hf digestion, purified membrane Envs are Endo Hf-sensitive, and thus rich in high-mannose carbohydrates. c Flow cytometry was used to study Env surface expression and recognition by the 2G12 glycan-dependent antibody and the VRC01 CD4-binding site antibody. d To immunoprecipitate cell-surface Env, 293T cells transiently expressing the indicated Envs were incubated with antibodies, washed and lysed. Cell lysates were incubated with Protein A-Sepharose beads. Precipitates were Western blotted with a goat anti-gp120 antibody. e To assess cell-surface Env processing, cells expressing the indicated Envs were biotinylated as described in Methods. The cell lysates (upper panel) or deglycosylated cell-surface Envs (lower panels) were Western blotted with the 4E10 anti-gp41 antibody. After deglycosylation, the uncleaved Env is 75 kD, and the cleaved transmembrane Envs are 20–23 kD. f An α-complementation assay was used to measure Env-mediated cell-cell fusion. The reduced cell-cell fusion activity of Env(+)Δ712 FT was restored by the disruption of fibritin trimerization in the Env(+)Δ712 FTmut glycoprotein. g The infectivity of recombinant luciferase-expressing HIV-1 with the indicated Envs was measured on Cf2Th-CD4/CCR5 target cells. The luciferase activity in the target cells was normalized to that observed for the Env(+)Δ712 glycoprotein. h Virions pseudotyped with the indicated Env proteins were purified through a 20% sucrose cushion, denatured and Western blotted. Data in this figure are representative of, or averaged from, those obtained in at least two independent experiments. Error bars are standard deviations
