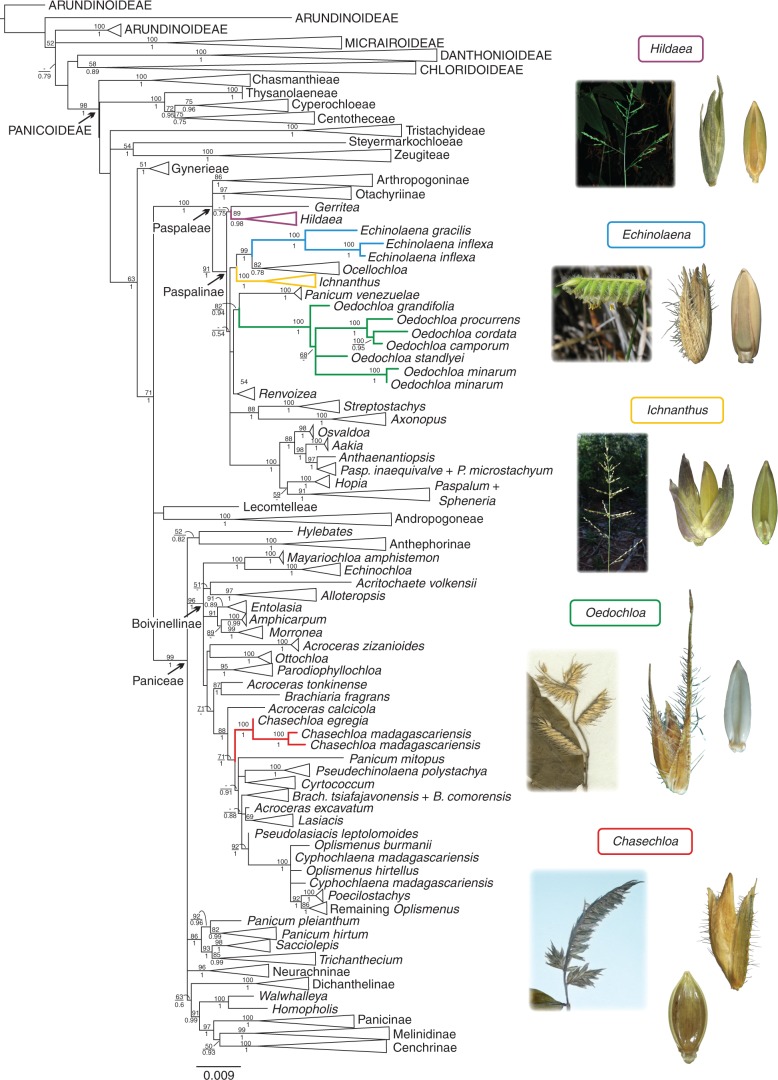
Fig. 1.
Maximum likelihood (ML) phylogram from the analysis of the plastid marker ndhF showing the phylogenetic placement of Chasechloa. ML bootstrap support values are indicated above branches and Bayesian support values below the branches. Some branches were collapsed to reduce the length of the tree. The full tree is available in Fig. S1.

