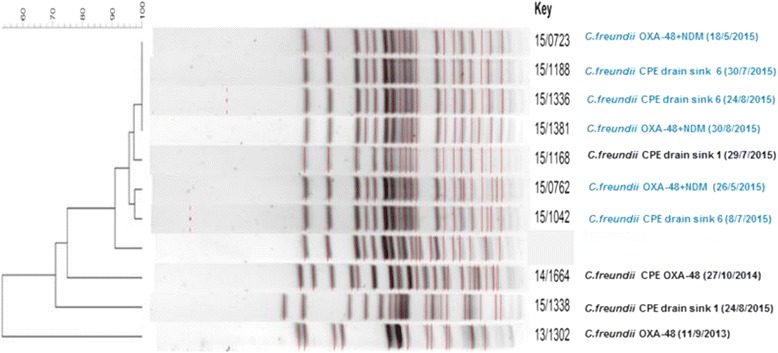
Fig. 1.

Phylogenetic relatedness between Citrobacter freundii CPE strains. On the left side of the figure, a dendogram is shown representing the relationship between the strains in %. In blue, the patients’ and drain cultures from ICU A bed 6 are shown and in black, the patients’ and drain cultures from ICU A bed 1are represented together with the date of isolation. The strains isolated from patients and sinks in room 6 are highly related
