. 2016 Aug 26;12(37):7792–7803. doi: 10.1039/c6sm01186a

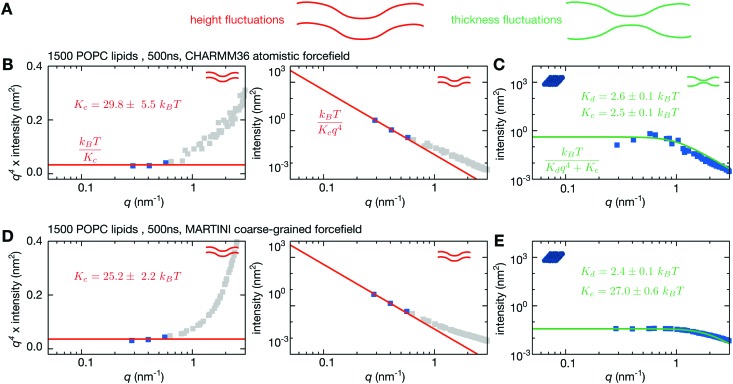
Fig. 2. A coarse-grained simulation of 1500 POPC lipids yields similar height fluctuations to a simulation run using an all-atom forcefield. (A) Both the height and thickness of a lipid bilayer can fluctuate. (B) The power spectra of the height fluctuations for the all-atom simulation of the bilayer are plotted as grey squares on a log–log plot. The value of K c is fitted on a plot of q 4 × intensity of the height spectrum vs. q. This is more accurate since all points fitted have equal weight. Since Helfrich–Canham (HC) theory is only valid for small q, only values with q < 0.6 nm–1 are considered – these are coloured blue. The fit is drawn as a red line and the value of K c is predicted to be 29.8 ± 5.5k B T. This is then plotted on the conventional power spectrum of the height fluctuations. (C) The HC form for the thickness fluctuations is fitted directly onto the power spectrum of the thickness fluctuations (shown by the green line) yielding K d = 2.6 ± 0.1k B T and K e = 2.5 ± 0.1k B T. The same analysis is repeated for a MARTINI coarse-grained simulation of the same duration. (D) K c is predicted to be 25.3 ± 1.8k B T and therefore agrees within error. (E) By contrast, the power spectrum of the thickness fluctuations is different, which is reflected in values of K d = 2.4 ± 0.1k B T (which agrees with the atomistic simulation) and K e = 26.7 ± 0.7k B T (which is ∼10× larger than the atomistic simulation). Convergence times and errors are calculated as described in the Methods and the (Fig. S2 and S3, ESI).

Fig. 2