. 2016 Aug 26;12(37):7792–7803. doi: 10.1039/c6sm01186a

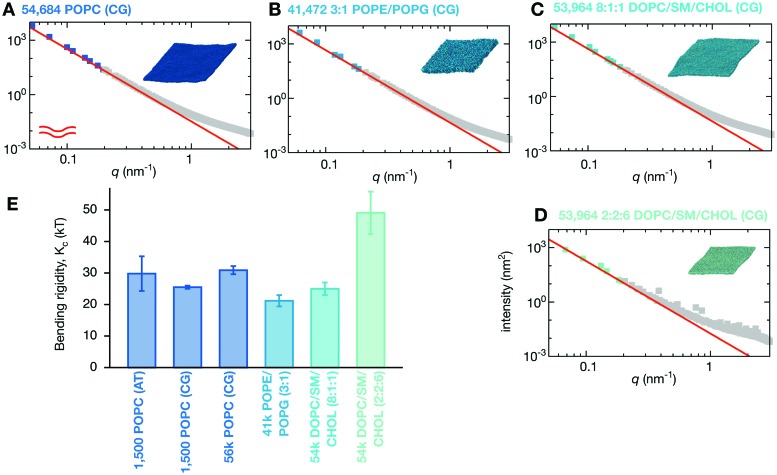
Fig. 4. Changing the lipid composition alters the bending rigidity of the bilayer. (A) For comparison the power spectrum of the height fluctuations of the large POPC bilayer is shown. This and all other fits are derived from Fig. S6 (ESI) which weights each point equally. The analysis is repeated for (B) the two-component POPE/POPG (3 : 1) bilayer and the three-component DOPC/sphingomyelin/cholesterol bilayers in (C) low-(8 : 1 : 1) and (D) high-cholesterol (2 : 2 :6) mixtures. (E) A bar chart showing the variation in calculated values of the bending rigidity, K c. Error bars are drawn. Convergence times and errors are calculated as described in the Methods and the (Fig. S4 and S5, ESI). The power spectra of the thickness fluctuations can be found in Fig. S7 (ESI).

Fig. 4