. 2016 Aug 26;12(37):7792–7803. doi: 10.1039/c6sm01186a

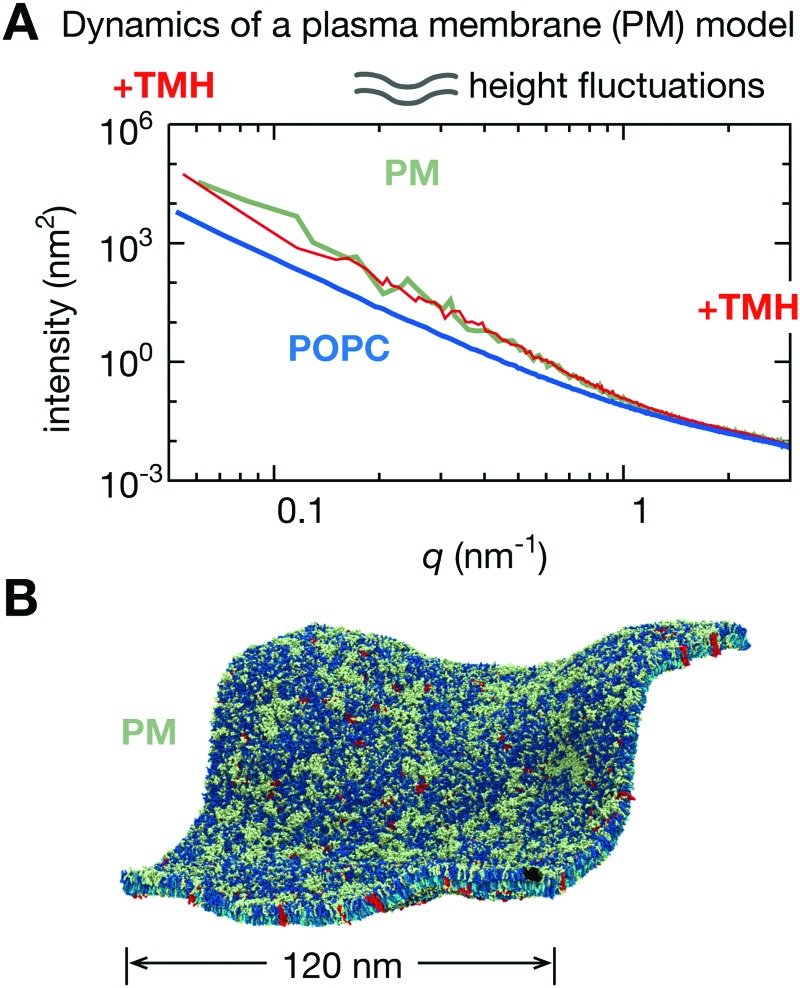
Fig. 7. A more realistic model of the plasma membrane has large fluctuations in both height and thickness. (A) Inserting 576 copies of the transmembrane helix (TMH) of the gp130 cytokine receptor reduces the intensity of both the height and thickness power spectra. Since this is a log–log plot, this indicates the plasma membrane model is significantly less rigid as the pure POPC bilayer. (B) An image of the bilayer containing the transmembrane helix (in red) illustrating the large degree of curvature. We note that this bilayer, since it is becoming highly curved, can no longer be viewed as a perturbation from a flat sheet and therefore using the Monge gauge, h(x, y), to describe the height fluctuations, as done here, will become less appropriate.

Fig. 7