. 2016 Aug 11;16(19):3804–3814. doi: 10.1039/c6lc00764c

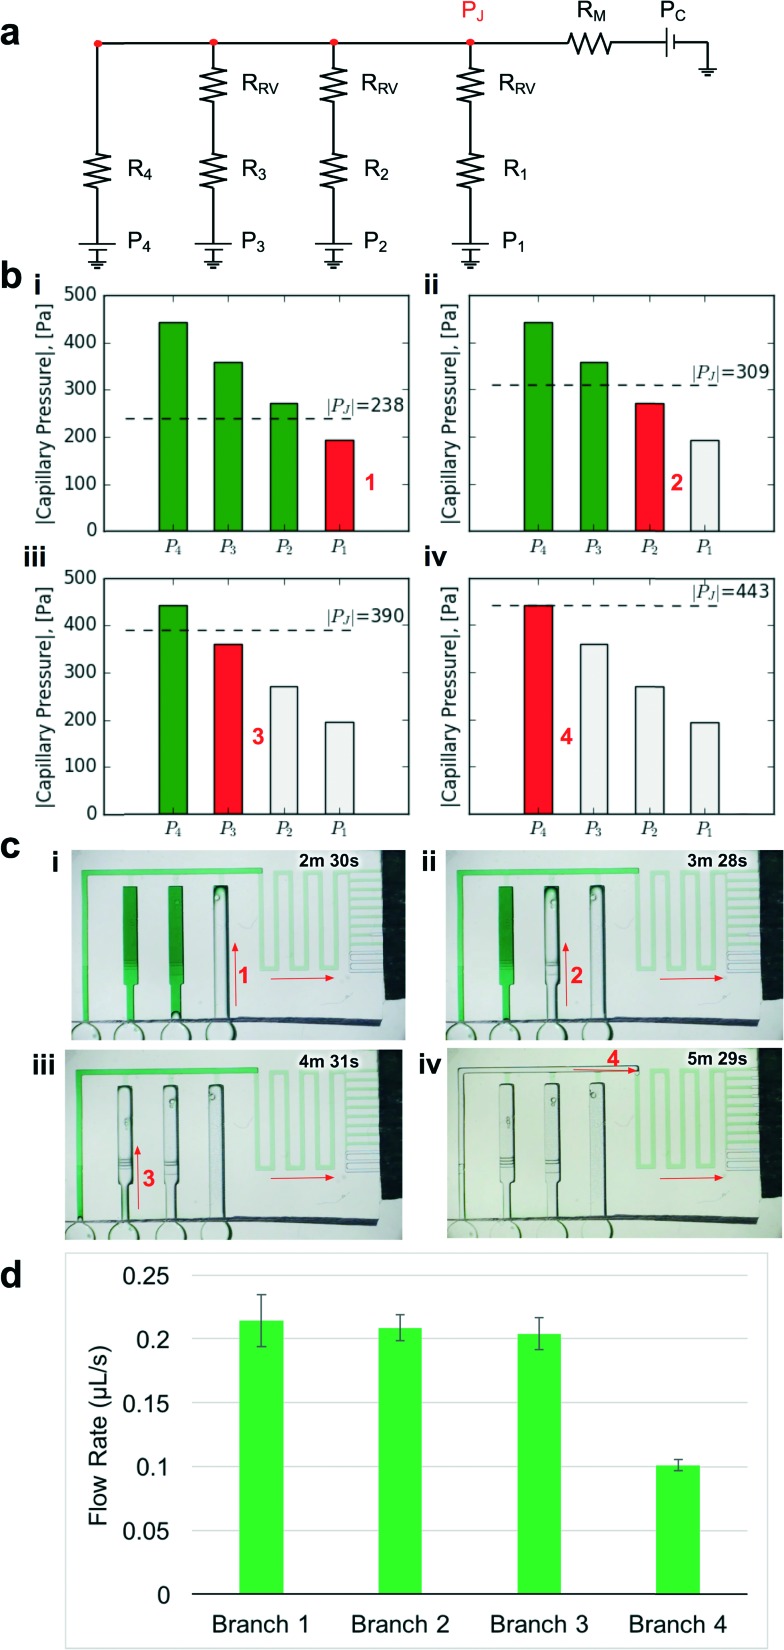
Fig. 4. Design and experimental validation of CC for autonomous delivery of four liquids. a) Electric circuit analogue showing the flow resistances and capillary pressures in the CC. b) Graphs showing the calculated junction pressures during bursting of each RBV. Junction pressures were designed to ensure that RBVs burst sequentially. c) Time-lapse images showing autonomous and sequential drainage of reservoirs in the CC. Arrows represent sequence and flow direction. Text labels show time during liquid delivery. A video of the autonomous liquid delivery operation is provided in movie S1. d) Flow rates for different branches of the capillaric circuit. N = 3 devices from different 3D-printed molds. Error bars represent standard deviation.

Fig. 4