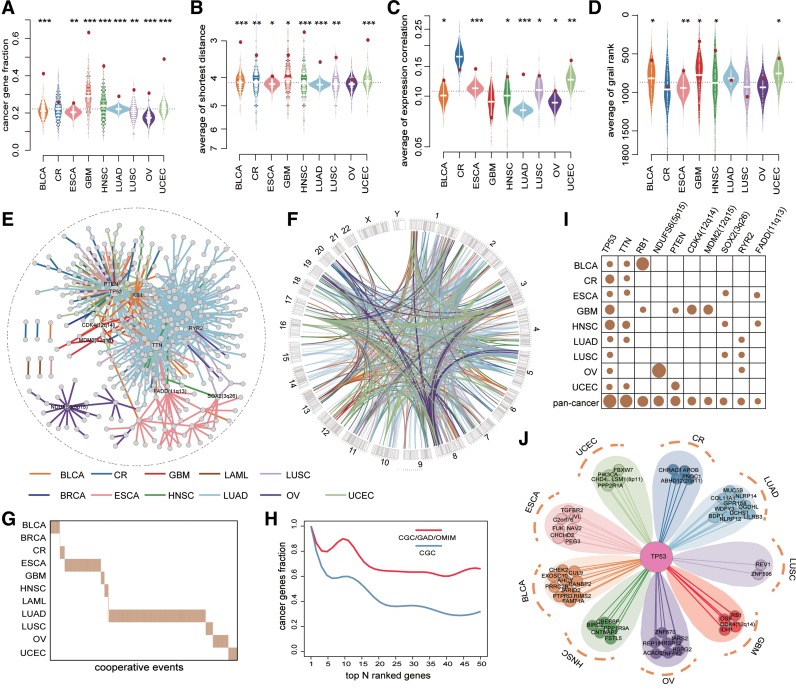
Figure 2.
Networks of somatic cooperative alterations across 12 cancer types. (A-D) The distribution of the fraction of cancer genes (A), the average shortest distance in PPI network (B), the average expression correlation (C), average grail similarity rank (D) for random gene pairs in 1000 permutations. The red point indicates the average value of all cooperative events for each cancer, an empirical P value is calculated by permutation test. (E) Pan-cancer cooperative network merged from individual cancers. The different colors of edges represent different cancers. (F) Circos plot for all cooperative events in pan-cancer. The different colors of links represent different cancers. (G) The cooperative events in each cancer show few overlap. (H) The fraction of top genes ranked by the degree in pan-cancer network that are included in the CGC (red) and CGC/GAD/OMIM (blue). (I) The degree distribution of top 10 genes in pan-cancer network for each cancer and pan-cancer. (J) The cooperative partners of TP53 across 9 cancer types.

