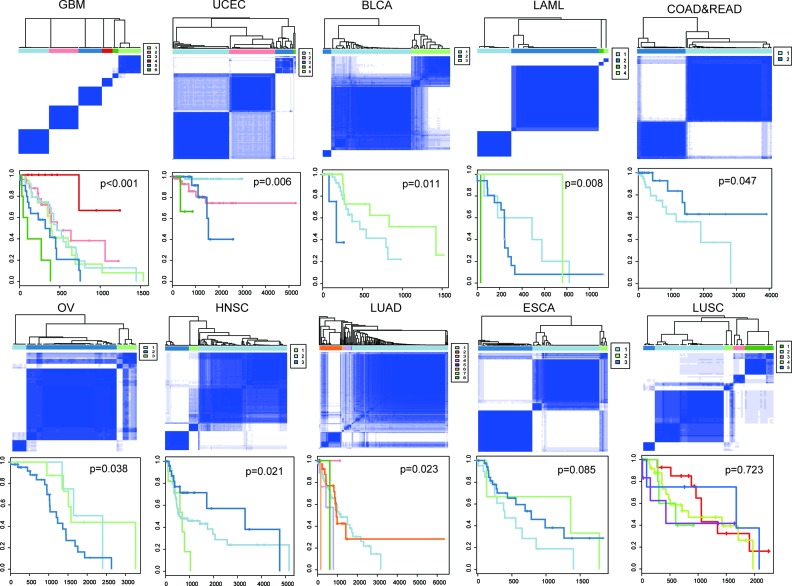
Figure 4.
Kaplan-Meier plot of cancer-specific survival for subtypes in each cancer. Co-clustering matrices (top) and Kaplan-Meier survival plots (bottom) were shown for ten cancer patients. For BRCA, only one cooperative event was identified, so samples were classified based on co-occurrence of this gene pair. Kaplan-Meier plot for BRCA is shown in Supplementary Figure S12D.

