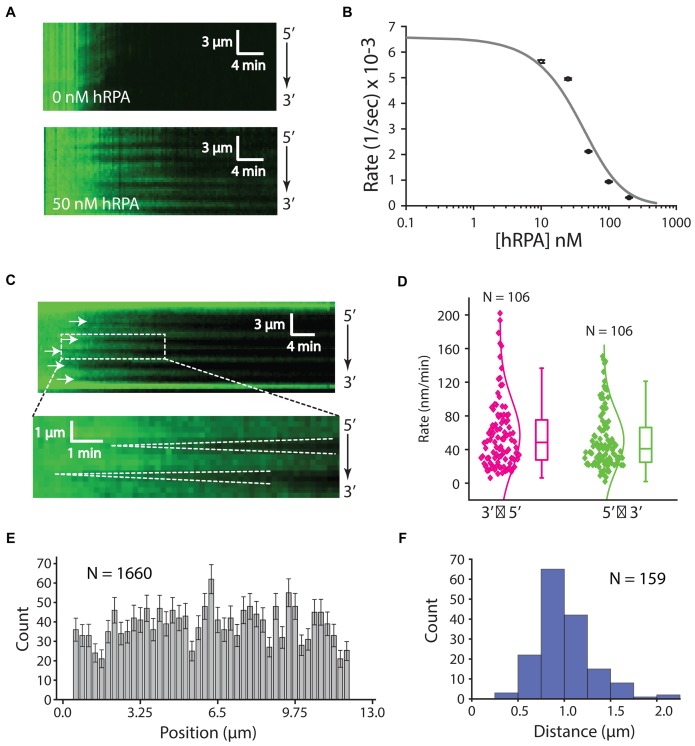
Figure 4.
Influence of hRPA on RAD51 presynaptic complex assembly. (A) Assembly of the RAD51 filament on ssDNA-hRPA in the presence of free hRPA-eGFP. Representative kymograph showing dark RAD51 (750 nM) binding to hRPA-eGFP coated ssDNA in the presence or absence of 50 nM free hRPA-eGFP, as indicated. (B) Plot of hRPA-eGFP dissociation rates after injection of 750 nM RAD51 with different concentrations of free hRPA-eGFP in buffer containing 2 mM ATP, 1 mM Mg2+ and 5 mM Ca2+. Each rate was calculated from at least 42 different ssDNA molecules (see Supplementary Figure S3B). The resulting data were fitted to the adjusted hill equation for competitive inhibition by hRPA. (C) Kymographs highlighting individual nucleation events (white arrowheads) and the bi-directional RAD51 filament growth. (D) Plot showing filament elongation rates for 5′→3′ and 3′→5′ growth. (E) Position distribution histogram showing the locations of different RAD51 nucleation events along the length of the ssDNA substrate; error bars correspond to std. dev. obtained from bootstrapping. (F) Size distribution histogram reporting the lengths of RAD51 filaments based on the distances between adjacent nucleation events, as highlighted by the white arrowheads in (C) for 750 nM RAD51 with 50 nM RPA.

