Figure 5.
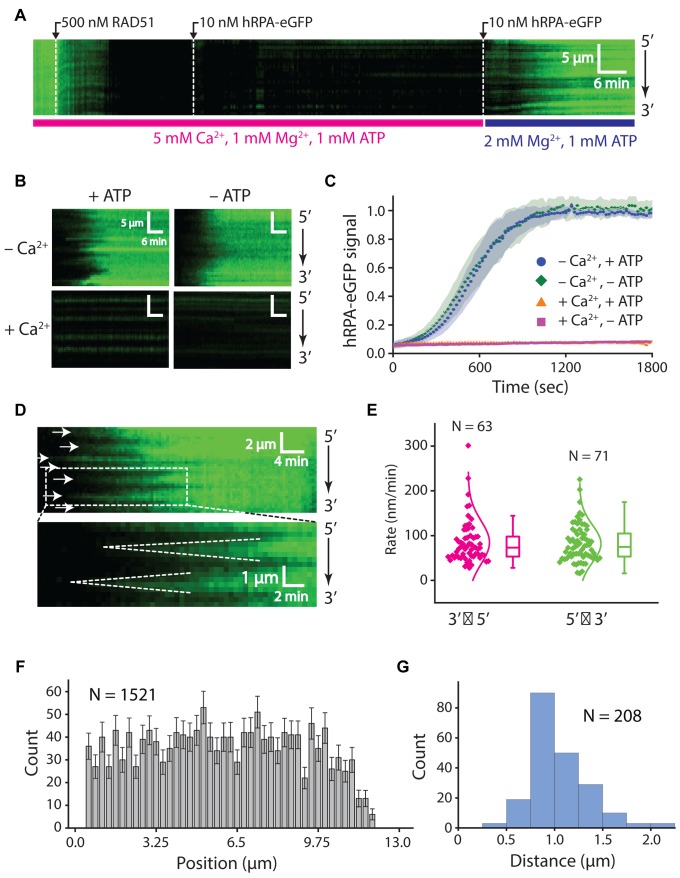
Disassembly of the RAD51 presynaptic complex. (A) Kymograph showing the assembly of an RAD51 filament on hRPA-eGFP coated ssDNA in buffer containing 1 mM ATP, 1 mM Mg2+ and 5 mM Ca2+. Free RAD51 was removed by chasing with buffer containing 1 nM hRPA-eGFP, and filament disassembly was initiated by chasing with buffer lacking Ca2+. (B) Kymographs showing the behavior of pre-assembled the RAD51 filaments when chased with buffers with and without Ca2+, ATP, or both, as indicated. (C) hRPA-eGFP normalized signal intensity versus time after injection of free hRPA-eGFP as a readout of RAD51 dissociation. Signal increase is the result of binding of free hRPA-eGFP that follows the dissociation of RAD51 from ssDNA. Shaded regions on the curves represent standard deviation, at least 23 ssDNA molecules were measured for each condition. (D) Kymographs highlighting the bi-directional disassembly of RAD51 filaments as visualized by re-binding of fluorescent hRPA-eGFP. White arrows highlight the positions at which disassembly initiates, and dashed lines highlight examples of bi-directional filament disassembly. (E) Plot showing filament disassembly rates for 5′→3′ and 3′→5′ dissociation. (F) Position distribution histogram showing the locations at which RAD51 filament dissociation initiates along the ssDNA; error bars correspond to std. dev. obtained from bootstrapping. (G) Size distribution histogram reporting the lengths of RAD51 filaments based on the distances between adjacent positions at which disassembly initiates; as highlighted by the white arrowheads in (D).

