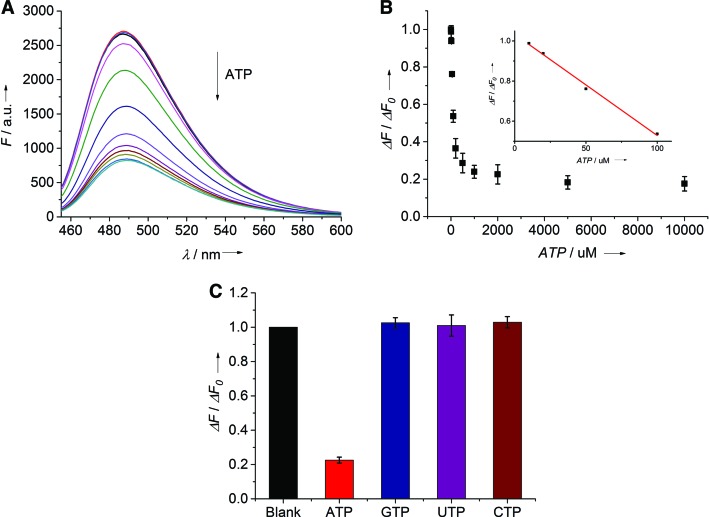
Figure 2.
Fluorescent analysis of ATP molecules by using ThT as a reporter. (A) Fluorescence emission spectra of ThT with increasing concentrations of ATP (from top to bottom): 0, 10, 20, 50, 100, 200, 500, 1000, 2000, 5000, 10000 μM. (B) Plot of the relative fluorescnence intensity change at 488 nm (ΔF/ΔF0) versus the concentration of ATP. The inset displays a linear relationship (R2 = 0.994) in the concentration range from 10 to 100 μM. (C) Selectivity of ATP against other analogs including GTP, UTP, CTP at 2 mM.

