
Figure 3.
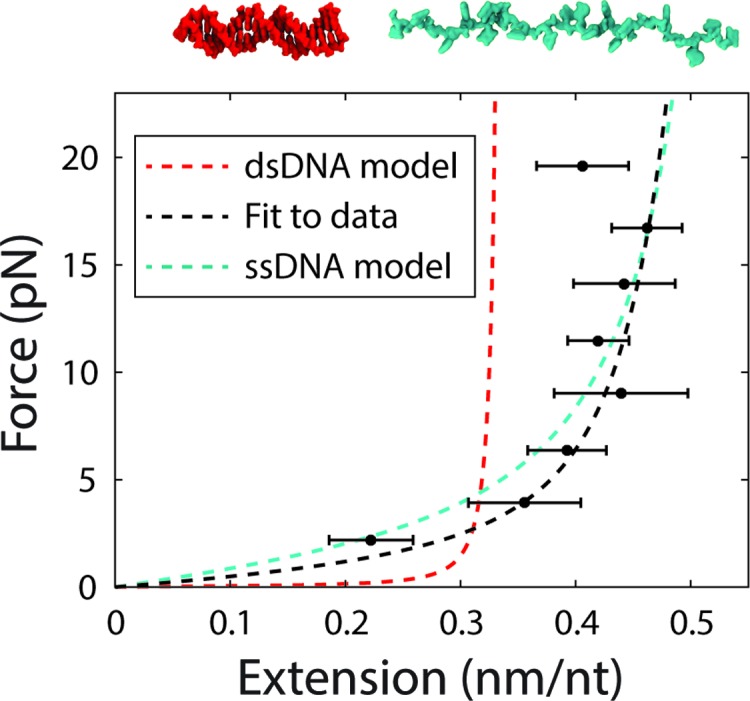
Force-extension curve of the transition state for hybridization. The end-to-end extension of the transition state was calculated from Equation (7). The model for the transition state using the fitted parameters for P‡ and h‡ (black dotted line) is plotted alongside the models for dsDNA (red dotted line) and ssDNA (cyan dotted line) for comparison.