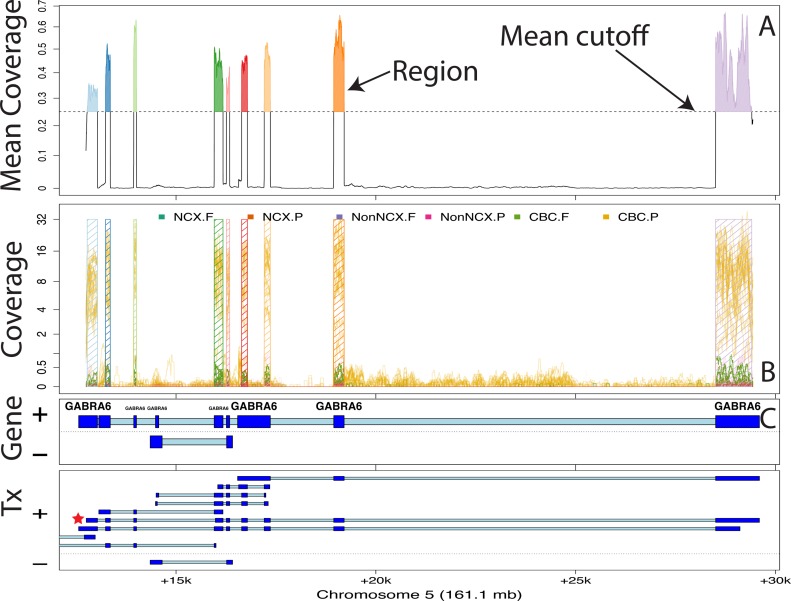
Figure 2.
Finding regions via expressed region-level approach on chromosome 5 with BrainSpan data set. (A) Mean coverage with segments passing the mean cutoff (0.25) marked as regions. (B) Raw coverage curves superimposed with the candidate regions. Coverage curves are colored by brain region and developmental stage (NCX: Neocortex: Non-NCX: Non-neocortex, CBC: cerebellum, F: fetal, P: postnatal). (C) Known exons (dark blue) and introns (light blue) by strand for genes and subsequent transcripts in the locus. The DERs best support the GABRA6 transcript with a red star, indicating the presence of a differentially expressed transcript.

