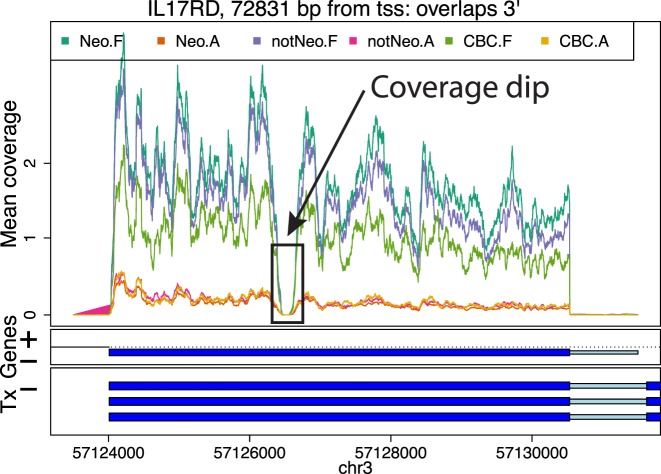
Figure 4.
Example of a coverage dip. Mean coverage per group for the BrainSpan data set for a region that results in two DERs for a single exon due to a coverage dip. The genome segment shown corresponds to the DERs cluster ranked 15th in terms of overall signal by the single base-level approach applied to the BrainSpan data set.

