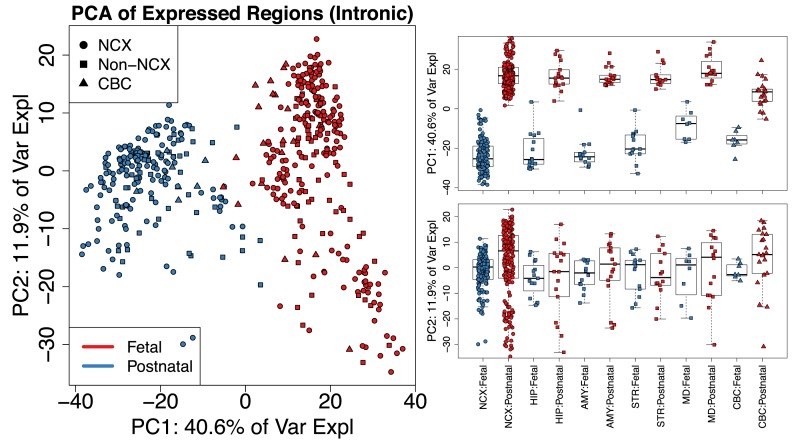
Figure 5.
Principal components analysis reveals clusters of samples in the BrainSpan data set. (Left) First two principal components (PCs) with samples colored by sample type (F: Fetal or P: Postnatal) and shape given by brain region using only the strictly intronic ERs. Analysis of other subsets of ERs produce similar results (Supplementary Figure S1). (Right) Boxplots for PCs 1 and 2 by brain region (NCX: neocortex, HIP: hippocampus, AMY: amygdala, STR: striatum, MD: thalamus, CBC: cerebellum) and sample type with non-neocortex brain decomposed into its specific regions. Using the single base-level approach (Supplementary Figure S2) produces similar results as shown in Supplementary Figure S3.

