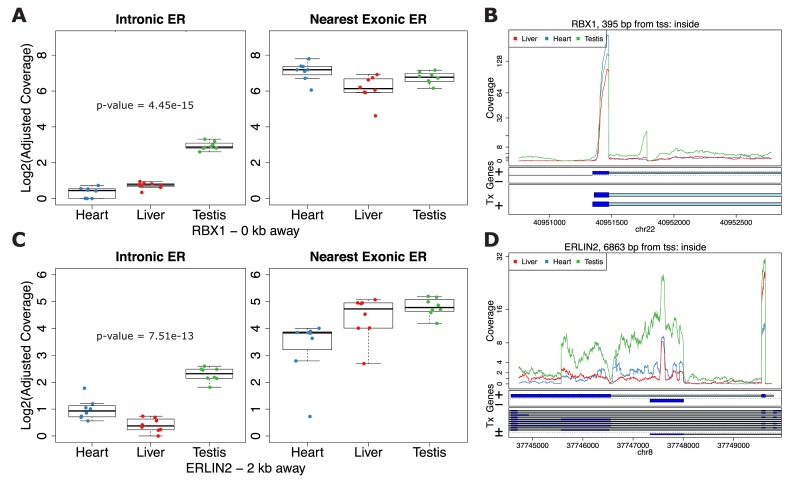
Figure 7.
Differential expression on strictly intronic ERs adjusting for expression on the nearest strictly exonic ER. Boxplots (A and C) and region coverage plots (B and D) for two strictly intronic ERs showing differential expression signal adjusting for the nearest exonic ER. Boxplots show the log2 adjusted coverage for the strictly intronic ERs by tissue with the corresponding boxplot for the nearest strictly exonic ERs. The P-value shown is for the differential expression between tissues on the intronic ERs conditional on the expression values for the nearest exonic ERs. The distance to the nearest strictly exonic ER and the gene symbol are shown below. The region coverage plots are centered at the strictly intronic ER with the neighboring 2 kb and 5 kb for (C) and (D), respectively. (A and B) Expression on the exonic ER is fairly similar between the groups but different on the intronic ER. (C and D) Expression on the exonic ER has an increasing pattern from heart to liver to testis but has a different pattern on the intronic ER.

