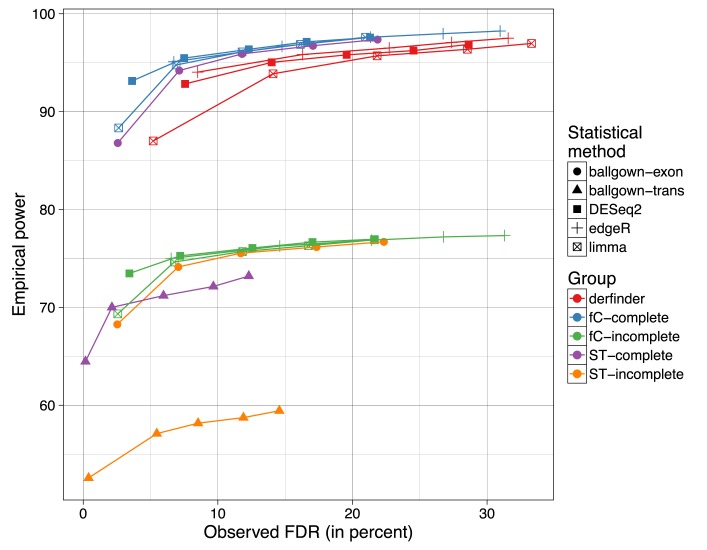
Figure 8.
Mean empirical power versus observed FDR across the three simulation replicates for a combination of statistical and summary methods. For FDR cutoffs of 1, 5, 10, 15 and 20% the mean empirical power and FDR across the 3 simulation replicates is displayed for the combination of statistical method (ballgown at exon or transcript level, limma, DESeq2, edgeR-robust) the summary method (derfinder, featureCounts (fC), StringTie (sT)) and whether the annotation used was complete or not (complete, incomplete).

