Figure 8.
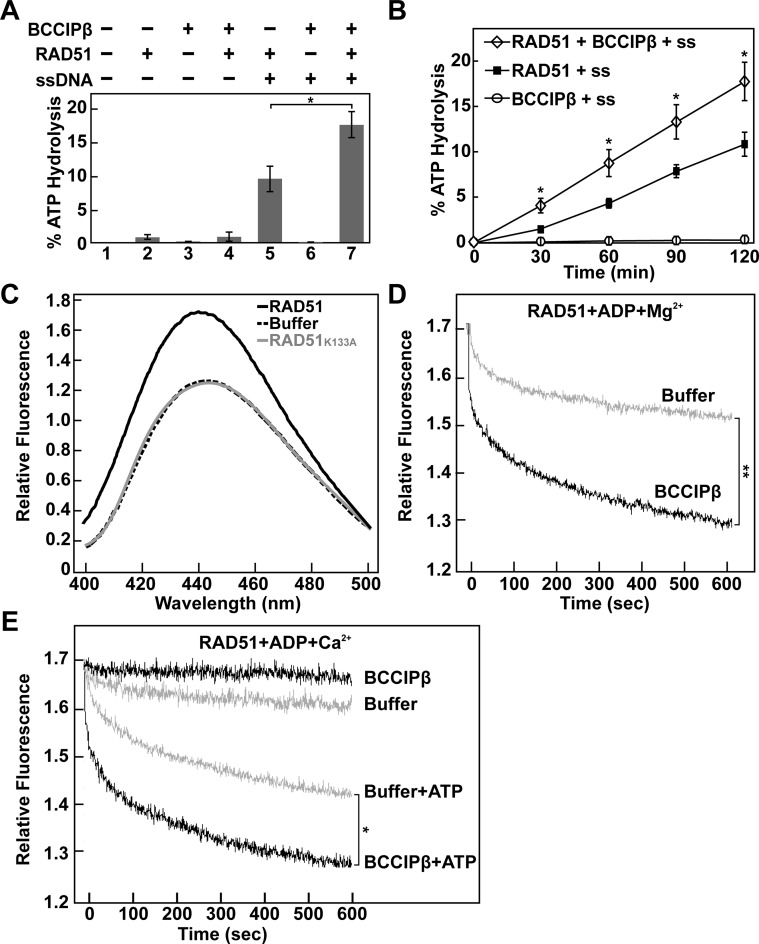
BCCIPβ stimulates RAD51 ATP hydrolysis and promotes ADP release. (A) RAD51 (0.5 μM) ATP hydrolysis assay in the presence or absence of ϕX174 ssDNA (60 μM nucleotides) and BCCIPβ (1 μM). (B) Time course analysis of RAD51 (0.5 μM) ATP hydrolysis in the presence of ϕX174 ssDNA (60 μM nucleotides), with or without BCCIPβ (1 μM). Error bars represent s.e.m. (n = 3); P-value *< 0.05. (C) Fluorescence spectra (400–500 nm) of MANT-ADP (0.5 μM) and ϕX174 ssDNA (2.0 μM nucleotides) in the absence or presence of RAD51 or RAD51K133A (0.5 μM). (D) Time course analysis of MANT-ADP dissociation from a RAD51-MANT-ADP-ssDNA complex in the presence of magnesium with or without BCCIPβ (1 μM). (E) Time course analysis of MANT-ADP release from the RAD51-MANT-ADP-ssDNA filament in the presence of calcium with or without BCCIPβ (1 μM) and/or ATP (5 μM), as indicated. P-value *< 0.05 and **< 0.01 is indicative of the 600 s time point.

