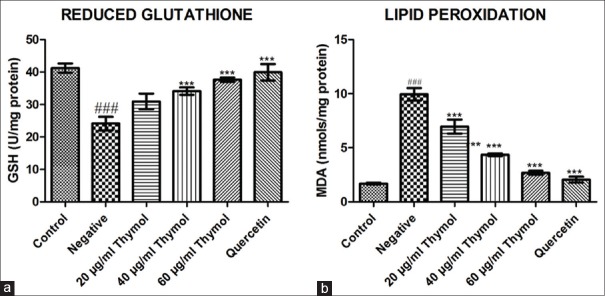
Figure 4.
Effect of thymol on reduced glutathione (a) and lipid peroxidation levels (b) on high-glucose-induced cataract in isolated goat lens. Data expressed as mean ± standard error of the mean, n = 4; ### denotes significant difference (P < 0.001) with respect to the control group, *** denotes significant difference (P < 0.001) with respect to the negative control group using one way ANNOVA followed by Dunnett's test

