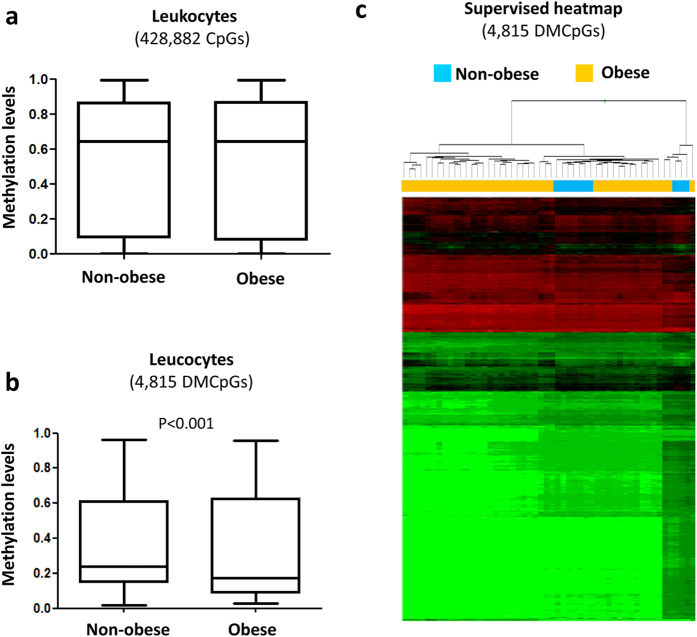
Figure 3. Profile of DNA methylation depending on obesity state in leukocytes.
Differences in the global methylation levels of the overall valid CpGs between the obese and non-obese leukocyte samples (a). Global differences in the methylation levels of the 4,815 differentially methylated CpGs identified by 450-k array analysis (b). Supervised clustering of the 4815 CpGs that were found to be differentially methylated between the obese and non-obese group (c). P-values were computed using wilcoxon rank sum test.

